
Mobile technology can transform field operations, but for many organizations, implementation remains a roadblock. It’s usually not because of the technology, though. In fact, 70% of transformation initiatives fail because of poor adoption, according to research by McKinsey.
The teams getting mobile right track the success signals so they can proactively support their technicians as they make the move from expensive reactive firefighting to proactive, strategic facility and maintenance management.
- Login frequency, mobile work order creation, and support ticket patterns reveal adoption problems while you can still fix them. Waiting for lagging indicators means resistance has already hardened into permanent workflows and you’ve lost critical momentum
- When your app works but usage lags, the problem isn’t technical—it’s that technicians haven’t bought into the benefits. Prove how mobile makes their specific jobs easier rather than treating real-time entry as surveillance or administrative burden
- Faster completion times, fewer return visits, and better compliance rates prove mobile delivers ROI to leadership. When you track both adoption metrics and operational improvements, you build the compelling story that secures continued investment across your facility portfolio
If you catch problems early, you can prove value consistently. Execution, though, depends on knowing exactly which metrics to watch and when they matter.
What are the right metrics to track for a mobile app rollout in field services?
Download counts and training completion rates are part of the big picture, but they can’t tell you if the team has changed long-standing behaviors for improved outcomes.
What you need is the right combination of metrics that show whether your rollout is gaining traction or turning into a “zombie app,” technically alive but functionally not, where everyone has the software on their phone, but no one uses it, and most of the team has fallen back into the bad habits of unreliable workflows.
Leading vs lagging indicators
Successful mobile rollouts require tracking two distinct indicator types that work together to paint a complete picture of adoption health and business impact.
Leading indicators show you what’s happening right now—whether technicians are logging in, creating work orders on mobile, and asking the right questions. These metrics act as your early warning system, revealing adoption problems while you still have time to fix them.
Track these as soon as the rollout starts and check them daily for the first 60 days, when behavior patterns are still forming.

Lagging indicators prove whether all that activity translates into business value—faster completion times, fewer return visits, better compliance rates. These metrics matter to leadership because they demonstrate ROI and justify continued investment.
The challenge is that it can take months to accumulate meaningful data, which is why you can’t rely on them alone during rollout.
Login frequency: Are technicians using the app every day?
Strong adoption shows daily logins with multiple sessions as technicians reference the app throughout their shifts. Weak patterns show sporadic weekly access or logins only when supervisors ask for work order updates.
Watch for warning signs like login rates below 50% after the first week, declining frequency after initial training, or long gaps between sessions suggesting technicians use the app only for required compliance documentation.
If login frequency does drop, investigate immediately. Start by speaking directly with technicians to identify barriers. You need to find out if it’s related to specific issues with the app and training or a more generalized resistance to change overall.
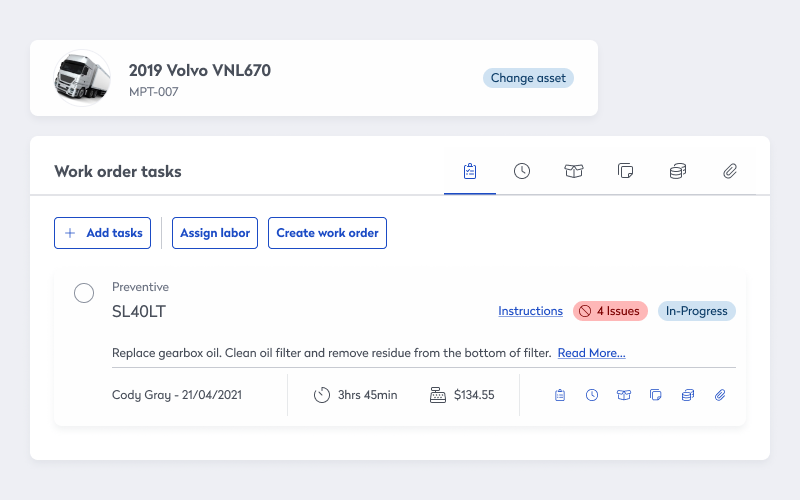
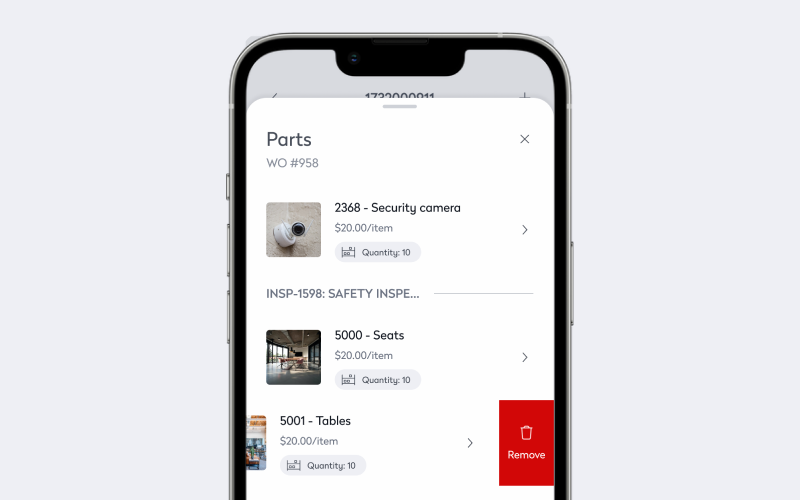
Mobile work order creation: Is adoption real or “compliance theater”?
The goal isn’t 100% mobile usage, because some tasks make more sense on a desktop, but mobile should be the primary tool for field work.
Red flags include majority of work orders still created from desktop despite technicians being in the field, or patterns showing technicians take notes on paper then transcribe to desktop later, defeating app’s value entirely.
Low mobile work order creation often signals behavioral resistance, not technical failure. If your app is solid but usage lags, it’s likely because technicians aren’t fully convinced of the benefits.
Are they reverting to comfortable habits like paper notes? Do they view real-time entry as surveillance rather than a tool to eliminate end-of-day admin? When the tech works but the people don’t use it, the fix isn’t a software update. Instead, it’s change management that proves how mobile makes their specific jobs easier.
Support request patterns: Where is implementation hitting friction?
Healthy patterns show support requests peaking early in the process before declining steadily, with questions shifting from “how do I…” to “can I also…” as technicians master basics and explore advanced features.
Tickets should cluster around specific features or workflows, not spread randomly across the entire application. Warning signs include support tickets remaining high or increasing after a few weeks, repeated questions about the same features suggesting training gaps, or tickets revealing fundamental workflow confusion rather than feature-specific questions.
After early adoption: What proves mobile was worth the money?
Adoption metrics show technicians are using mobile, but it’s your lagging indicators that prove mobile is saving money. Look for faster completion times, fewer return visits, better compliance rates. It’s where adoption translates into return on investment (ROI).
“If you can show that you are increasing revenue and increasing human productivity, then you are moving in the right direction in the world now, right? Not just increasing revenue. You can take that all the way down to an individual employee,” explains James Waddell, President and Chief Research & Innovation Officer at Cognitive Corp, on the Asset Champion podcast episode “A Very Real Trend – The Impact of AI on Asset and Facility Management.”
The dual impact matters because mobile implementations succeed only when they deliver measurable business outcomes while simultaneously making technicians’ jobs easier.
When you track both dimensions, you build the compelling story that secures continued investment and expansion across your facility portfolio.
Work order completion time: What efficiency gains prove ROI?
Set a specific goal for reduction in average completion time, with greatest improvements in work orders requiring asset history research, parts identification, or multi-step troubleshooting.
Faster completion times mean more work orders closed per technician, reduced backlog, and lower labor costs per completed order, which all directly impacts your department’s productivity metrics and proves ROI when budget conversations arrive.
Segment by work order type, including emergency, preventive maintenance, and projects, because each has different baseline completion times. Compare pre-mobile baselines to post-implementation performance for the same work order types to ensure valid comparisons.
Remember that buildings with older systems or complex asset configurations see greater improvements because mobile access to maintenance histories and troubleshooting guides deliver more value than in newer, well-documented facilities.
First-time fix rates: Are technicians bringing the right parts?
Mobile access to asset information, maintenance histories, and parts inventories should reduce diagnostic errors and multiple-visit scenarios.
Look for improvement in first-time fix rates and a corresponding reduction in return visits for the same issues. Greatest improvements typically occur in HVAC, electrical, and specialized equipment maintenance where parts and diagnostic complexity are highest.
Every return visit means duplicated labor costs, extended equipment downtime, and reduced occupant satisfaction. Improving first-time fix rates directly reduces maintenance costs while improving service quality—the rare scenario where you simultaneously cut costs and improve outcomes.
Launch a mobile program that delivers results
Eptura has helped organizations across manufacturing, healthcare, government, and commercial real estate implement mobile programs that scale. To learn more about rollout strategies, training approaches, and success criteria tailored to your facility portfolio—schedule a consultation with an expert.
Frequently asked questions
By Jonathan Davis
As a content creator at Eptura, Jonathan Davis covers asset management, maintenance software, and SaaS solutions, delivering thought leadership with actionable insights across industries such as fleet, manufacturing, healthcare, and hospitality. Jonathan’s writing focuses on topics to help enterprises optimize their operations, including building lifecycle management, digital twins, BIM for facility management, and preventive and predictive maintenance strategies. With a master's degree in journalism and a diverse background that includes writing textbooks, editing video game dialogue, and teaching English as a foreign language, Jonathan brings a versatile perspective to his content creation.