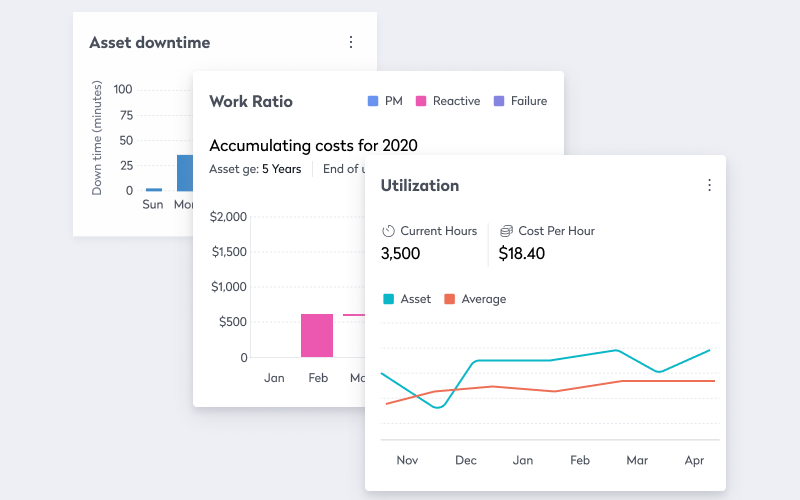
Every organization wants to get more value from its assets. The challenge is determining whether capacity constraints stem from insufficient assets, maintenance issues, operating inefficiencies, or uneven demand. Asset utilization helps answer critical questions by showing how effectively assets generate value over time.
Key takeaways
- Asset utilization reveals hidden capacity: Utilization data helps you identify where capacity is being lost, where demand exceeds availability, and where underused assets could support additional work without additional capital investment
- The seven-factor calculation provides operational context: Breaking utilization into planned downtime, operating losses, production losses, downtime, quality losses, and performance losses helps you understand why utilization rates change, not just what the final percentage is
- Better utilization supports better decisions: When you combine utilization metrics with maintenance, labor, and operational data, you can improve planning, rebalance workloads, reduce bottlenecks, and prioritize investments more effectively
Asset utilization works best when you move beyond the calculation itself and focus on the decisions it supports. Understanding where and why capacity is lost can help you uncover opportunities to improve output, reliability, and asset performance across the enterprise.
Why asset utilization reveals more than asset performance
Physical assets represent significant investments across industries. Organizations may manage facilities, fleets, machinery, production equipment, tools, and supporting infrastructure, spread across multiple locations. Because these assets consume capital, labor, maintenance resources, and operating budgets, leaders need a reliable way to understand whether they’re generating expected value.
Asset utilization measures how efficiently an organization uses those assets. At its simplest, utilization compares an asset’s potential productive capacity with its actual productive output. A higher utilization rate generally indicates that assets spend more time generating value and less time sitting idle, operating below capacity, or waiting for work.
Many organizations historically viewed utilization as a maintenance or production metric. Today, it plays a much larger role in operational planning. Utilization data helps reveal hidden capacity, highlight allocation issues, expose bottlenecks, and support decisions about labor, scheduling, maintenance, inventory, and asset lifecycle management.
Issues don’t often stem from a lack of assets. Instead, the challenge is understanding whether existing assets already have unused capacity that the organization hasn’t identified. Asset shortages and underused assets frequently exist at the same time. Solving that contradiction starts with measuring utilization correctly.
Measure where capacity is lost across seven factors
Asset utilization calculations can look complicated because multiple factors affect productive capacity throughout the year. The advantage of a framework is that it helps you identify exactly where capacity is being lost. Instead of focusing only on the final utilization percentage, break the calculation into the seven categories of losses that influence asset performance.
- Calculate annual planned downtime: Start by calculating downtime required for planned maintenance activities. Preventive maintenance, inspections, servicing, calibration, and compliance work all reduce available operating hours. Although planned downtime lowers short-term utilization, it often protects long-term utilization by preventing larger failures
- Factor in lost operating time: Include operational downtime unrelated to maintenance. Holidays, shutdowns, shift schedules, and other planned operating constraints reduce the number of productive hours available annually. Assets that do not operate continuously should include these losses in the calculation
- Include production losses: Business demand also affects utilization. Production schedules can change because of seasonality, inventory levels, supply chain constraints, changing customer requirements, or market conditions. An asset cannot generate value when there is no work available for it to perform
- Account for unscheduled downtime: Unexpected breakdowns represent one of the most visible utilization losses because they remove productive capacity without warning. Unplanned downtime often affects more than the failed asset itself. It can disrupt production schedules, delay deliveries, create labor inefficiencies, and cause bottlenecks elsewhere in the operation
- Include quality losses: Not all operating hours create value. If an asset produces defective products, failed outputs, or unusable work, those hours represent lost productive capacity. Convert quality losses into equivalent production time when calculating utilization
- Include production rate losses: Assets frequently operate below their rated capacity. For example, a machine capable of producing 5,000 units per hour may consistently produce 3,500 because of setup constraints, operator practices, material issues, or process inefficiencies. That reduction in output should be reflected as a utilization loss
- Calculate utilization: Add all losses together and subtract them from the annual maximum of 8,760 hours. To calculate the utilization percentage, divide productive operating hours by total available hours and multiply by 100. The resulting figure creates a baseline you can compare across assets, facilities, and operational periods
Once you’ve completed the calculation, the real value comes from interpretation. The utilization percentage itself is only the starting point. The seven factors help you identify whether capacity is being lost because of maintenance requirements, demand fluctuations, downtime, quality issues, or operating inefficiencies, giving you a clearer basis for improving output and uncovering hidden capacity.
Find hidden capacity before investing in additional assets
When output falls short of demand, teams often assume additional assets are required. Utilization data frequently reveals a different story. The organization may already have available capacity trapped inside operational silos, scheduling constraints, or inefficient allocation decisions.
A fleet may appear fully utilized even though several vehicles remain idle during certain periods. A production facility may struggle to meet demand even though one line consistently operates below capacity. A maintenance team may request additional equipment while similar assets elsewhere remain underused.

Before approving new capital purchases, look for opportunities to unlock existing capacity. Analyze operating schedules, maintenance patterns, labor availability, production bottlenecks, and asset allocation. In many cases, operational improvements deliver higher returns than new investments. Many organizations also use connected maintenance data to support repair-versus-replace decisions.
Asset utilization analysis depends on having reliable information about both the assets themselves and the environments where they operate. As Kylash Ramesh, Integrated Workplace and Facility Asset Program Manager at NIH, explained in “‘Supplement the Data’ – Asset Management Decision-Making for Owners & Integrating Data and Human Experiences,” “These are the two primary data sets that owners must commit to maintaining for efficient facility management,” referring to space and asset data.
Balance underused and overused assets across the operation
Asset utilization becomes even more valuable when viewed across groups of assets rather than individually. Many organizations discover that utilization imbalances exist alongside apparent shortages. One group of assets experiences heavy demand while another sits underused. One site struggles with recurring bottlenecks while another maintains available capacity.
These situations often indicate allocation issues rather than true capacity limitations.
Look for patterns, including:
- Assets at one location operating near capacity while similar assets elsewhere remain available
- Production lines experiencing significantly different utilization rates
- Facilities carrying duplicate assets with dramatically different workloads
- Maintenance resources concentrated around some assets while others receive minimal use
Consistently overutilized assets face greater wear, higher maintenance costs, and increased risk of failure. Consistently underutilized assets can indicate excess inventory, weak planning, poor scheduling, or opportunities for redeployment.
Balance utilization across assets to improve reliability, preserve flexibility, reduce operational risk, and support business goals.
Use utilization data to make better planning decisions
When organizations connect utilization data with maintenance histories, work orders, labor availability, operating costs, and production schedules, the metric becomes a planning tool that supports more effective maintenance planning.
You can use utilization insights to support:
- Maintenance planning
- Labor allocation
- Inventory optimization
- Production scheduling
- Capacity planning
- Capital investment decisions
Strong planning teams establish a baseline, identify trends, compare alternatives, and evaluate the impact of changes over time. Utilization data does not tell you what decision to make. Utilization data helps identify which decisions deserve attention first.
That distinction matters because high utilization isn’t automatically good and low utilization isn’t automatically bad. What matters is understanding the factors driving the result and how those factors affect operational performance.
Leverage AI-assisted analytics to identify utilization patterns
As utilization datasets grow larger, AI-assisted analytics can help you identify recurring patterns, utilization imbalances, and emerging capacity constraints more quickly. Instead of spending time sorting through reports, you can focus on evaluating opportunities, comparing options, and deciding where to act. When combined with maintenance histories, work orders, and operational data, AI can help surface insights that support faster planning decisions
Avoid these common mistakes when interpreting utilization data
Utilization metrics create the most value when organizations interpret them correctly. The calculation itself is only the starting point. The real challenge is understanding what utilization data reveals about demand, capacity, asset allocation, and operational performance.
Teams that jump to conclusions can overlook hidden capacity, misdiagnose bottlenecks, or make unnecessary capital investments. A broader view of maintenance data and operational decision-making helps provide the context utilization metrics need.
Common mistakes to watch out for include:
- Treating all low utilization as a performance problem: Some assets intentionally operate below capacity to preserve flexibility, redundancy, or resilience
- Relying only on averages: Overall utilization rates often conceal important differences between individual assets, locations, or operating periods
- Ignoring demand patterns: Seasonal fluctuations, production cycles, and operating schedules affect utilization and should influence interpretation
- Comparing unlike assets: Assets with different operating requirements and business purposes rarely produce meaningful direct comparisons
- Buying more assets before analyzing capacity: Utilization often reveals opportunities to improve output through reallocation, scheduling, and maintenance improvements instead
Avoiding these mistakes helps transform utilization from a reporting metric into a decision-making tool. The strongest utilization programs challenge assumptions, evaluate utilization in operational context, and look for the factors driving the result rather than the percentage alone. When teams combine utilization data with demand patterns, maintenance histories, and operational requirements, they can uncover opportunities to improve output, rebalance workloads, and make more informed investment decisions
Turn utilization insights into operational improvements
When you can identify where capacity is being lost, where demand exceeds availability, and where assets remain underused, you can make more informed decisions about scheduling, maintenance, allocation, and investment. Those insights can help you increase output, improve reliability, and delay unnecessary capital spending.
Consistent improvement depends on more than periodic reporting. You need connected asset data, maintenance histories, analytics, and workflows that help you understand why utilization changes and what actions deserve attention first.
For a closer look at the tools organizations use to create that foundation, explore Eptura Asset.
Frequently Asked Questions

By Jonathan Davis
As a content creator at Eptura, Jonathan Davis covers asset management, maintenance software, and SaaS solutions, delivering thought leadership with actionable insights across industries such as fleet, manufacturing, healthcare, and hospitality. Jonathan’s writing focuses on topics to help enterprises optimize their operations, including building lifecycle management, digital twins, BIM for facility management, and preventive and predictive maintenance strategies. With a master's degree in journalism and a diverse background that includes writing textbooks, editing video game dialogue, and teaching English as a foreign language, Jonathan brings a versatile perspective to his content creation.