


Workplace experience leaders are no longer asked what tools they use; they’re asked what those tools deliver.
In stakeholder reviews, feature lists don’t move decisions. Proof does. Executives want to see how workplace investments translate into higher space utilization, stronger adoption, and better collaboration across teams. They want numbers, trends, and a clear story about what’s working and what to do next.
The good news? Modern workplace experience platforms already capture the data leaders’ care about. The challenge is knowing which signals matter, how to measure them, and how to present outcomes in a way that secures confidence and continued investment.
Key takeaways
- Booking analytics and visitor flow data translate workplace experience into measurable RO
- Utilization, adoption, and collaboration signals are strong predictors of valu
- Dashboards simplify reporting and secure faster approvals
Why KPIs matter for WX ROI
Workplace experience (WX) leaders must tie their work back to measurable business outcomes—not just anecdotes about “happy employees” or “modern tech.” KPIs are the bridge between WX activities and what leadership actually cares about: efficiency, collaboration, and strategic value.
According to Eptura’s 2025 Workplace Index, organizations are entering a new phase of workplace optimization:
- 34% of businesses are planning to increase the number of days employees spend in the office, putting more pressure on utilization, cleaning, visitor management, and operational workflow
- Desk bookings per building increased 33% year-over-year, showing that hybrid demand isn’t weakening—it’s evolving
These aren’t nice-to-know stats, they’re “must-measure” KPIs that tell your stakeholders whether their investment in experience tools is driving real usage and business behavior.
From features to outcomes: what leaders want to see
Leaders don’t invest in features. They invest in change, momentum, and value. Utilization rates, adoption trends, and cross-team collaboration signals become proof points when presented with clarity and context.
The Workplace Index also revealed that data fragmentation remains a key barrier to insight, with 58% of organizations reporting multiple dashboards as their biggest analytical challenge and 37% needing 11+ FTEs just to manually collate and report worktech data.
This trend underscores why integrated dashboards and consolidated analytics matter: they turn data chaos into defensible KPI narratives.
Adoption is the signal that matters most
Adoption isn’t just a metric; it’s proof that your experience platform is delivering value.
On the Workplace Innovator podcast, guests often highlight that “only a fraction of organizations treat workplace experience as a business priority,” and that WX professionals must present data in ways that align with broader enterprise goals (such as real estate optimization, employee productivity, and collaboration outcomes).
Whether it’s adoption of desk bookings, visitor check-ins, or mobile engagement features, growth in adoption directly correlates with leadership confidence.
Visualizing impact with real-time dashboards
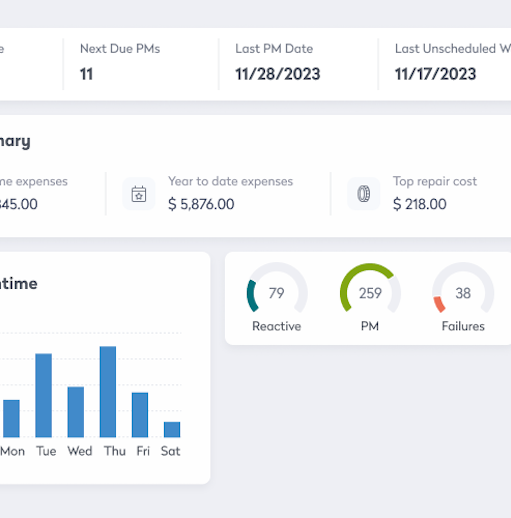
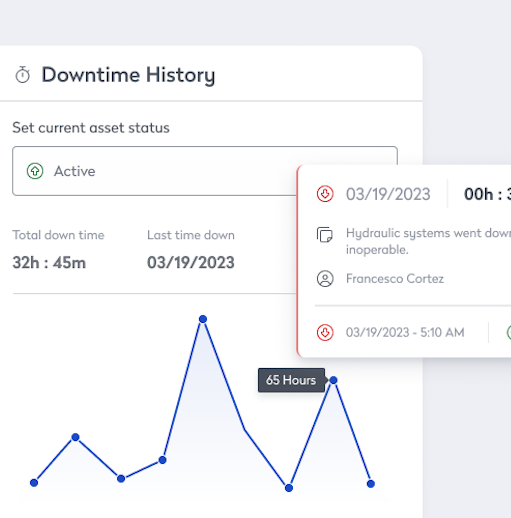
Dashboards turn raw signals into stories leadership can understand in minutes—not hours.
Instead of exporting spreadsheets, try showing stakeholder groups how utilization moves week over week, how booking volumes correlate with collaboration events, and where unexpected patterns (like mid-week peaks) are emerging.
Example dashboard benefits for stakeholder conversations:
- Occupancy and peak usage windows highlight staffing and maintenance needs
- Booking adoption curves justify investment in UX and communications
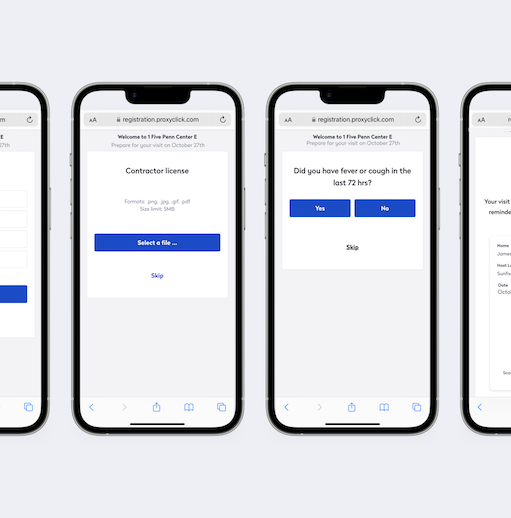
- Visitor flow analytics connect workplace systems with real-world partner and client engagement
These visualizations shift conversations from “What are we doing?” to “Here’s what’s happening—and here’s why it matters.”
Example: WX KPI scorecard for stakeholder reviews
Embed a simple scorecard in your next stakeholder deck to anchor discussions around progress and decisions:
| Metric | Target | Current | Trend | Status |
|---|---|---|---|---|
| Desk utilization rate | 70% | 64% | ▲ Improving | Improving |
| Meeting room utilization | 65% | 71% | ▲ Exceeding | Exceeding |
| Employee booking adoption | 80% | 76% | ▲ Improving | Improving |
| Visitor check-in compliance | 95% | 92% | ▬ Stable | Stable |
This format helps leadership quickly see where the investment is working—and where it needs more enablement or support.
Real-World Proof Points
- Arup unified workplace operations across 80 sites using Eptura solutions. This move resulted in more efficient space utilization, improved collaboration, and higher employee satisfaction. Arup’s experience demonstrates the value of consolidated analytics and standardized processes, turning fragmented data into actionable insights that drive business outcomes.
- Rendall & Rittner transitioned from static desk assignments to flexible booking, optimizing space for a mobile workforce. This shift improved operational efficiency and empowered employees to choose how and where they work, directly supporting higher adoption rates and better space utilization.
- Sodexo implemented self-service tools for space reservations and navigation, enabling a more intentional, employee-driven office experience. As a result, Sodexo reduced their office footprint by 50%, proving that workplace technology can deliver both cost savings and a better employee experience.
- Dimension Data cut visitor check-in times by 50% using Eptura Visitor, demonstrating how automation and analytics drive operational improvements. Faster check-ins not only enhance the visitor experience but also free up staff for higher-value tasks, supporting overall workplace efficiency.
3 steps to baseline and track WX KPIs
- Establish a baseline
Capture at least 30–60 days of utilization and adoption data before making changes. Baselines make trends defensible. - Align metrics to business goals
Map experience KPIs to outcomes that matter to your CFO, CHRO, and operations leads. - Standardize reporting
Use dashboards and scorecards consistently so stakeholders know what to expect and how to interpret the numbers.
See the impact live
Dashboards turn workplace experience into something leadership can see, measure, and act on.
Book a demo to explore how Eptura dashboards help WX leaders prove impact in real time.
Frequently asked questions

By Amanda Meade
Amanda Meade is a content creator at Eptura, specializing in workplace experience, meeting productivity, and emerging trends in workspace planning and visitor management. With a background in content marketing and SEO, she crafts clear, actionable content that helps teams work smarter through in-office collaboration. Throughout her career, Amanda has worked across industries, including home services, healthcare, real estate, and SaaS, developing a unique ability to distill complex topics into practical insights.