Replacement asset value (RAV) gives maintenance and asset teams a financial reference point for evaluating maintenance spending. When organizations compare annual maintenance costs with the current cost of replacing the assets they maintain, they can identify trends, investigate unusual results, and support more informed planning and investment decisions.
That financial context matters as organizations manage aging equipment, rising replacement costs, and growing pressure to balance maintenance spending with capital investment. Without a consistent way to compare maintenance expenses with the scale of the asset base, leaders can struggle to distinguish normal cost changes from emerging reliability problems, inefficient spending, or equipment approaching the end of its useful life.
The calculation itself is straightforward. The harder part is defining the asset population, developing current replacement estimates, capturing maintenance costs consistently, and understanding what the resulting percentage can and cannot indicate.
Key takeaways
- RAV measures current replacement cost: Replacement asset value estimates what it would cost today to replace an asset or asset population with equipment that provides equivalent function and capacity
- Consistency makes MC/RAV meaningful: Maintenance costs and replacement value must cover the same assets, use clearly defined cost categories, and follow a consistent methodology across reporting periods
- MC/RAV provides context, not a verdict: The percentage can identify changes and assets that deserve investigation, but condition, reliability, downtime, risk, and lifecycle costs must inform maintenance and replacement decisions
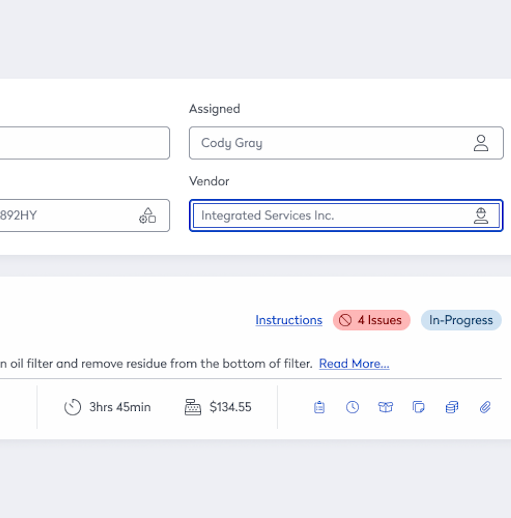
Only the right enterprise asset management (EAM) software can make getting and leveraging the right numbers more practical by helping you connect asset records, replacement estimates, work orders, labor, parts, contractor costs, condition data, and performance history.
Why replacement asset value matters for maintenance planning
Replacement asset value is the estimated current cost of replacing the assets and equipment an organization maintains with new assets of equivalent function and capacity. The estimate should reflect what replacement would cost today, not what the organization originally paid or what the assets show as depreciated book value.
A common way to explain RAV uses a theoretical total loss. If a facility and all its maintained equipment disappeared, how much would the organization need to spend to restore the same operating capability?
Replacement asset value establishes the financial scale of the asset base, but the goal is not simply to calculate a percentage. The goal is to make better decisions about how to maintain, repair, and invest in assets throughout their lifecycle.
As Kris Lengieza, Field Chief Innovation Officer at Procore Technologies, explained on an Asset Champion podcast episode, “I’m really thinking about those who are trying to find a new way or a better way to serve the life cycle of that building… whether they’re applying technology or a process, or they’re trying to just make sure that they leave it better than they found it.”
RAV supports that lifecycle perspective by helping maintenance, operations, and capital-planning teams understand maintenance spending in the context of the long-term investment required to sustain asset performance.
The answer extends beyond the purchase price.
Depending on the organization’s calculation method, replacement costs can include:
- Procurement: Purchase price, taxes, shipping, and import costs
- Installation: Labor, site preparation, renovations, and required expansions
- Commissioning and training: Testing, startup, and employee training
- Removal and disposal: Decommissioning, transportation, disposal fees, and environmental requirements
Organizations do not always include every category. Consistency matters more than choosing one universal definition. Teams need to define which costs fall within RAV, apply that definition across the asset population, and use the same approach when they update the calculation.
Important RAV, ERV, CRV, and RCN terminology
Maintenance, reliability, facilities, insurance, and capital-planning teams do not always use the same term for replacement value. Depending on the industry and methodology, organizations may encounter:
- Replacement asset value (RAV): The estimated current cost of replacing an asset or asset population with equipment that provides equivalent function and capacity
- Estimated replacement value (ERV): A term commonly used in maintenance benchmarking to describe the estimated cost of replacing the maintained asset base
- Current replacement value (CRV): The replacement value measured using current prices rather than historical acquisition costs
- Replacement cost new (RCN): The estimated cost of replacing an asset with a new equivalent before accounting for depreciation
These terms often describe closely related concepts, but organizations should not assume that every source calculates them in the same way. One methodology may include installation, engineering, commissioning, training, and disposal, while another includes only the equipment purchase price.
So, the maintenance cost percentage may appear as MC/RAV or MC/ERV:
MC/RAV % = Annual maintenance costs ÷ Replacement asset value × 100
MC/ERV % = Annual maintenance costs ÷ Estimated replacement value × 100
The labels matter less than the underlying methodology. You need to document what the replacement estimate includes and use the same definition across facilities, asset groups, reporting periods, and benchmark comparisons.
RAV compared with book value and fair market value
Replacement asset value serves a different purpose from book value or fair market value. RAV estimates what an organization would need to spend today to restore equivalent operating capability. It does not represent the asset’s accounting balance or the amount the organization could receive by selling it.
Book value reflects the asset’s recorded acquisition cost after accumulated depreciation and other accounting adjustments. An older asset may have a low or zero book value even though replacing its operating capacity would require a substantial investment.
Fair market value estimates the price a willing buyer might pay a willing seller under current market conditions. Age, condition, demand, and the availability of used equipment can all affect that value.
RAV instead focuses on replacement. That distinction makes it more useful as the denominator in maintenance-spending comparisons because you need to understand annual costs in relation to the current investment required to replace the capability they support.
Replacement asset value formula and MC/RAV calculation
Maintenance teams usually apply RAV through the maintenance cost to replacement asset value percentage, often called MC/RAV.
MC/RAV % = (Annual maintenance costs ÷ Replacement asset value) × 100
Annual maintenance costs can include:
- Labor
- Contractor costs
- Parts and materials
- Preventive maintenance
- Corrective repairs
- Troubleshooting, inspections, and testing
- Maintenance planning and support costs included in the organization’s methodology
You should separate maintenance expenses from capital improvements, expansions, and modifications that increase an asset’s function or capacity. Including those projects can inflate the maintenance total and make comparisons less useful.
For example, an organization spends $10,000 annually to maintain assets with a combined RAV of $100,000.
($10,000 ÷ $100,000) × 100 = 10%
At the same annual percentage, ten years of maintenance spending would equal the asset population’s current replacement value. That comparison can help leaders understand the scale of ongoing maintenance spending, but it is conceptual rather than a financial forecast.
Inflation, changing labor and material costs, evolving maintenance requirements, equipment deterioration, and the time value of money mean the relationship will not remain static. The calculation also does not forecast failure or prove that the organization should replace the assets after ten years. You still need condition, reliability, risk, and lifecycle information before making an investment decision.
How to estimate replacement asset value accurately
The formula only produces a useful result when both inputs reflect a consistent scope. If the maintenance-cost total covers every maintained asset across a facility, the RAV must cover that same asset population. A mismatch between the numerator and denominator can create a percentage that looks precise but has little decision-making value.
Use current and defensible replacement-cost sources
For newer assets, you can start with recent capital costs and adjust them for inflation, installation requirements, and current market conditions. Historical purchase prices become less reliable as equipment ages, supplier markets change, and labor or construction costs increase.
You can develop or validate replacement estimates using:
- OEM and supplier quotes for current equipment, shipping, and required services
- Recent purchase prices for comparable assets acquired by the organization
- Insurance valuations that estimate the cost of restoring insured equipment or facilities
- Construction and equipment cost indices that adjust older estimates for market changes
- Recent projects at comparable facilities that include installation, engineering, and commissioning costs
- Current prices for functionally equivalent equipment when the original model is no longer available
A replacement estimate should reflect equivalent function and capacity, not necessarily an identical model. When technology, safety requirements, efficiency standards, or operating needs have changed, a true like-for-like replacement may no longer exist. In that situation, you should identify the modern asset or system that would provide the required operating capability and document the assumptions behind that choice.
Update estimates on a defined schedule
Replacement values can become outdated even when the physical asset population remains unchanged. Equipment prices, construction costs, labor rates, freight expenses, regulatory requirements, and currency movements can all change the amount an organization would need to invest.
Organizations should establish a formal update cadence. Many teams can review replacement estimates annually and conduct a more detailed reassessment after major market changes, renovations, acquisitions, expansions, or equipment upgrades. High-value or highly specialized assets may require more frequent supplier validation.
Each estimate should include its effective date, source, scope, and important assumptions. That record allows reviewers to distinguish genuine changes in maintenance performance from movements caused by an updated replacement estimate.
Define the MC/RAV methodology before comparing results
A consistent methodology prevents a precise-looking percentage from hiding incompatible inputs. Before you calculate or compare MC/RAV, they should document:
- Asset scope: Which facilities, systems, and individual assets the calculation includes or excludes
- Maintenance-cost scope: Whether the total includes internal labor, contractors, materials, supervision, planning, inspections, condition monitoring, and other support costs
- Capital-cost treatment: How the organization separates routine maintenance from upgrades, expansions, and projects that increase function or capacity
- Replacement-cost scope: Whether the estimate includes procurement, engineering, installation, commissioning, training, removal, and disposal
- Valuation assumptions: Which inflation factors, cost indices, supplier quotes, or equivalent-capacity assumptions support the estimate
- Update frequency: How often teams review maintenance costs and replacement values
- Approval ownership: Which maintenance, engineering, finance, facilities, or capital-planning leaders review and approve the methodology
No single definition will fit every organization. The goal is to create a method that you can apply consistently over time and explain when leaders review the results.
Connect maintenance costs with the correct assets
EAM software helps organizations apply that methodology across sites and asset groups. A centralized asset registry establishes which equipment belongs in each calculation, while connected work orders assign labor, parts, contractor services, inspections, and corrective work to the correct assets.
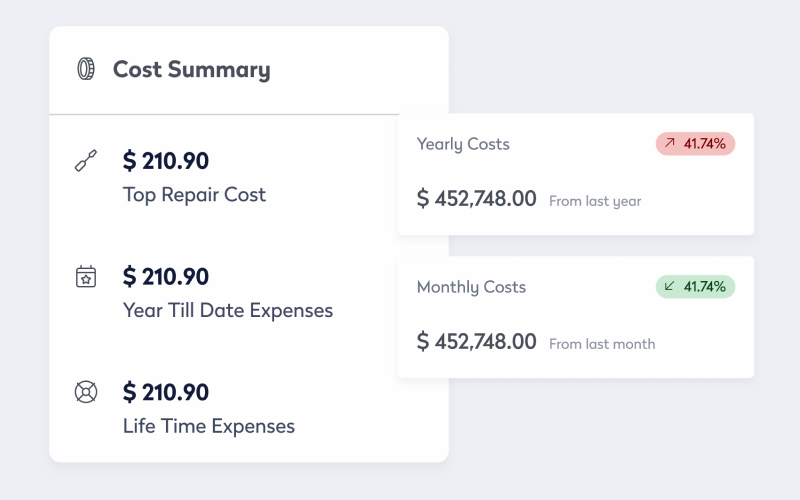
Standardized cost categories make it easier to apply the same maintenance definitions across facilities. Audit histories can preserve the source, effective date, assumptions, and approvals behind replacement-value estimates. Portfolio-level reporting can then show MC/RAV by facility, asset class, system, or individual asset without requiring you to rebuild the calculation from disconnected records.
That connected information also supports deeper analysis. Maintenance leaders can compare MC/RAV with downtime, condition, failure frequency, backlog, preventive maintenance compliance, and operational impact. They can identify changing cost patterns, investigate unusual results, and determine which assets require a more detailed repair-versus-replace evaluation.
MC/RAV insights and maintenance performance context
MC/RAV can help organizations understand maintenance spending in relation to the scale of the assets they support. It can also reveal changes that deserve further investigation.
The percentage can indicate if:
- Maintenance spending is rising or falling relative to RAV
- One facility or asset group requires a closer review
- Maintenance costs are becoming significant enough to influence capital planning
- Changes to maintenance strategy appear alongside changes in spending
- An individual asset has become a candidate for deeper repair-versus-replace analysis
MC/RAV cannot determine if:
- The maintenance program is effective
- Assets are reliable, safe, or compliant
- A low percentage reflects efficiency or deferred maintenance
- Two organizations use comparable cost definitions
- A specific asset should automatically be repaired or replaced
A low percentage can look positive while hiding under-maintenance, incomplete cost capture, growing backlogs, or deteriorating asset condition. A higher percentage can reflect inefficiency, but it can also result from aging assets, strict regulatory requirements, a harsh operating environment, or a deliberate reliability improvement program.
Maintenance leaders should review MC/RAV alongside measures such as downtime, availability, emergency work, preventive maintenance compliance, backlog, failure frequency, condition, and production or service impact. Together, those measures provide a more complete view of performance.
RAV benchmarks across industries and asset types
Organizations often hear that annual maintenance costs should equal approximately 2% of replacement asset value. The figure can provide a general reference point, but it does not represent a universal target or prove that a maintenance program is effective.
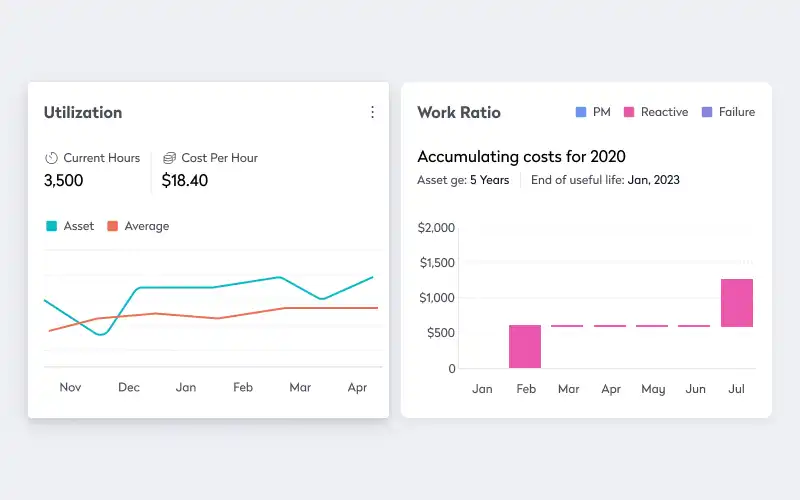
Appropriate maintenance spending varies according to industry, asset class, age, operating environment, utilization, criticality, regulatory requirements, and maintenance strategy. A chemical processing facility, hospital, aircraft fleet, distribution center, and commercial office portfolio can face fundamentally different inspection, compliance, reliability, and service requirements.
Even organizations in the same industry may calculate the percentage differently. One company may include contractor labor, maintenance supervision, engineering support, and condition-monitoring services, while another excludes them. One may calculate a fully installed replacement cost, while another uses equipment purchase prices. The resulting percentages can appear comparable even when the underlying methods are not.
External benchmarks become most useful when the organizations or facilities being compared use:
- Similar definitions of maintenance cost
- Similar replacement-value methodologies
- Comparable asset classes and operating environments
- Similar criticality and regulatory requirements
- The same reporting period and calculation scope
Internal trending usually provides a more reliable starting point. When an organization applies the same methodology year after year, you can identify changes and investigate what caused them.
A falling percentage might reflect improved efficiency, but it could also result from deferred work, incomplete cost capture, or a newly increased replacement estimate. A rising percentage might indicate worsening condition or growing repair demand, but it could also reflect corrected cost records, stricter compliance requirements, or a deliberate reliability-improvement program.
Asset class, operating context, and methodology often explain more of the difference than maintenance performance alone. Teams should use benchmarks to identify questions and exceptions, not as automatic pass-or-fail thresholds.
Replacement asset value for repair-or-replace decisions
At the asset level, RAV can help teams identify equipment that deserves closer financial analysis. Imagine an asset with an annual maintenance cost equal to 2% of its current replacement value. At the same spending rate, maintenance costs would take 50 years to equal the replacement value. If the percentage reaches 20%, annual maintenance spending would equal the replacement value in five years.
The higher percentage does not automatically mean the organization should replace the asset. You still need to consider reliability, condition, downtime, safety, compliance, remaining useful life, production impact, energy consumption, parts availability, and the cost of installing and commissioning a replacement.
A complete repair-versus-replace analysis should also consider the timing of future costs. A repair that appears less expensive today may create additional downtime, energy use, parts constraints, or repeated maintenance over the remaining life of the asset. A replacement may require greater initial capital but reduce operating risk or improve capacity, efficiency, safety, and supportability.

RAV helps establish the scale of the replacement investment, but you still need lifecycle costs and operational consequences to compare the alternatives. The metric identifies where deeper analysis may be worthwhile. It does not choose the final option.
RAV provides a common financial reference point for those discussions. It helps maintenance, operations, finance, and capital-planning teams see the scale of ongoing spending in relation to the investment required for replacement.
The metric can also support decisions about maintenance strategy. A rising MC/RAV percentage combined with repeated failures and increasing downtime may justify more detailed replacement analysis. A higher percentage paired with strong reliability and strict compliance requirements may show that the organization is making an appropriate investment to protect a critical asset.
RAV, facility condition assessments, and LORA
RAV, facility condition assessments, and Level of Repair Analysis answer related but different questions. A facility condition assessment (FCA) evaluates the physical condition and functional performance of buildings, infrastructure, and building systems. It helps you identify deficiencies, estimate renewal needs, prioritize corrective work, and develop capital plans. RAV establishes the scale of current replacement value, while an FCA provides evidence about condition and future requirements.
Level of Repair Analysis (LORA) focuses more directly on repair-versus-replace decisions. It brings together maintenance costs, asset history, downtime, condition, operational risk, remaining useful life, and lifecycle costs to evaluate whether continued repair creates more value than replacement.
Used together, the methods provide different layers of insight:
- RAV establishes the current financial scale of replacing the maintained asset base
- FCA identifies physical condition, deficiencies, and renewal priorities
- LORA evaluates the most practical and economical response for an asset or component
Neither an FCA nor LORA replaces the RAV calculation. They add the condition, risk, and lifecycle context that MC/RAV cannot provide on its own.
Turn RAV insights into better asset decisions
Replacement asset value does not provide a final verdict on maintenance performance or tell you exactly when to replace equipment. It provides a consistent financial reference point. When organizations combine RAV with reliable information about maintenance costs, asset condition, downtime, criticality, and operational impact, they can identify changing patterns earlier, investigate the assets that need attention, and build stronger cases for maintenance or capital investment.
EAM software turns an annual calculation into an ongoing decision-making process by connecting asset records, work orders, costs, condition, and performance history. You can standardize cost categorization across sites, preserve replacement-value assumptions, report MC/RAV across the portfolio, and support more detailed repair-versus-replace analysis.
To create that connected foundation, explore Eptura Asset.
Frequently Asked Questions

By Jonathan Davis
As a content creator at Eptura, Jonathan Davis covers asset management, maintenance software, and SaaS solutions, delivering thought leadership with actionable insights across industries such as fleet, manufacturing, healthcare, and hospitality. Jonathan’s writing focuses on topics to help enterprises optimize their operations, including building lifecycle management, digital twins, BIM for facility management, and preventive and predictive maintenance strategies. With a master's degree in journalism and a diverse background that includes writing textbooks, editing video game dialogue, and teaching English as a foreign language, Jonathan brings a versatile perspective to his content creation.