


For years, workplace teams measured occupancy to answer a simple question: How full is the office? Today, that question isn’t enough.
Corporate real estate leaders are being asked to reduce costs, support hybrid work, improve employee experience, and justify every square foot they manage. Occupancy and utilization metrics have become part of those conversations because they reveal something more valuable than attendance alone. They show whether a workplace is aligned with the way people actually work.
That’s an important distinction. An office can appear busy while entire desk neighborhoods sit empty. Another location may have modest attendance but struggle to provide enough collaboration space on peak days. Without context, both workplaces tell incomplete stories.
The goal isn’t to maximize occupancy or achieve a particular utilization percentage. It’s to understand what’s happening across the portfolio, identify meaningful patterns, and make decisions with confidence, whether that means redesigning a floor, consolidating space, or delaying an expensive expansion.
Key takeaways
- Occupancy and utilization metrics answer different questions. Occupancy shows how many people are in the office, while utilization reveals how effectively employees use different spaces. Together, they provide a complete picture of workplace performance
- Workplace data should drive decisions, not just reporting. Occupancy and utilization trends help corporate real estate teams determine when to consolidate space, redesign office layouts, adjust hybrid work policies, or plan for future growth
- One metric never tells the whole story. Combining badge access, desk bookings, occupancy sensors, and workplace analytics provides more accurate insights than relying on a single data source
- Long-term patterns matter more than peak attendance. Reviewing occupancy and utilization over weeks or months helps organizations avoid making expensive real estate decisions based on temporary fluctuations
- Successful workplaces optimize for employee needs, not maximum occupancy. The goal isn’t to fill every desk but to provide the right mix of workspaces while maximizing the value of the real estate portfolio
Occupancy and utilization measure different things
Occupancy and utilization are often discussed together because they’re closely related, but they answer different questions.
Occupancy tells you how many people are in the workplace during a given period. It helps answer operational questions like whether a building has enough capacity, which locations experience the highest attendance, and how office traffic changes throughout the week.
Utilization looks beyond attendance to examine how the workplace is being used. Which desks are occupied? Are meeting rooms sitting empty despite being reserved? Do employees gravitate toward informal collaboration spaces instead of assigned workstations?
The difference matters because attendance alone rarely explains whether a workplace is performing well.
Imagine two offices with identical occupancy rates on a Wednesday. One has employees spread across desks, meeting rooms, and project spaces throughout the day. The other has rows of unused desks while employees compete for a handful of collaboration rooms. On paper, occupancy looks the same. In practice, they’re telling two very different stories.
That’s why leading organizations evaluate both metrics together. Occupancy shows demand. Utilization explains how that demand is distributed across the workplace.
Measuring occupancy in a hybrid workplace
Measuring occupancy used to be relatively straightforward. Assigned seating made it easy to estimate how much office space was needed because employees generally worked from the same desk every day.
Hybrid work changed that assumption.
Employees now split their time between home and the office, reserve desks when needed, move between meeting spaces, and spend more of their day collaborating than working from a single workstation. Understanding occupancy requires more than counting assigned seats.
Most organizations combine information from several sources, including:
- Badge access systems
- Desk booking or hoteling platforms
- Visitor management systems
- Occupancy sensors
- Wi-Fi or network activity
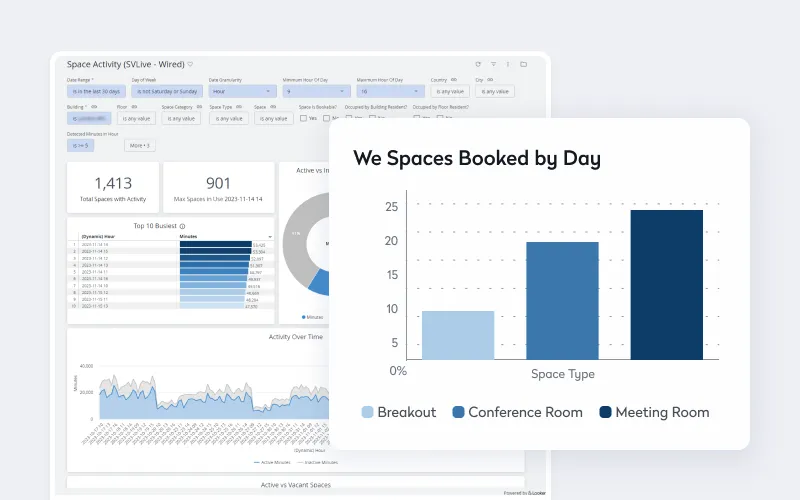
Each source provides a different perspective. Badge data confirms who entered the building. Booking data shows where employees intended to work. Sensors reveal whether reserved spaces were actually occupied. Looking at these sources together creates a far more reliable picture than relying on any one dataset.
Occupancy data also becomes more valuable when viewed over time instead of as a daily snapshot.
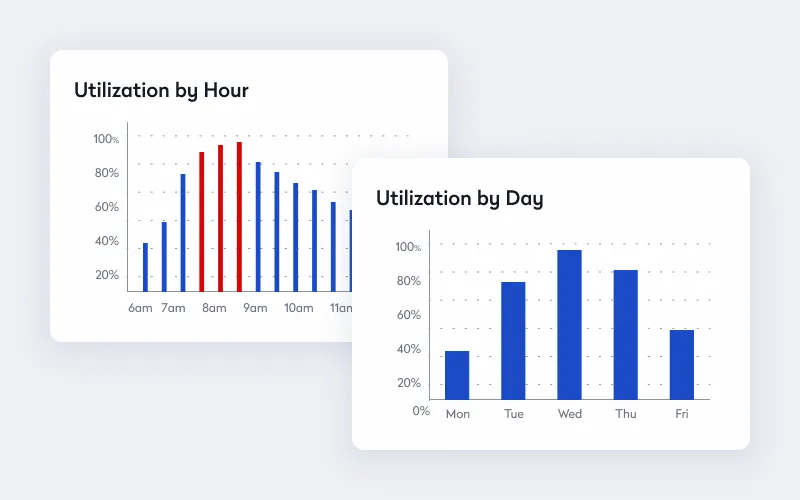
For example, many organizations continue to experience the “midweek mountain” identified in Eptura’s Workplace Index, with attendance peaking on Tuesdays through Thursdays and dropping at the beginning and end of the week. Looking only at Wednesday attendance could lead an organization to conclude it needs more office space, while reviewing the entire week may reveal substantial unused capacity.
Patterns like these are why workplace leaders increasingly focus on trends rather than isolated occupancy reports.
Utilization reveals how space actually performs
Occupancy tells you who came into the office. Utilization shows what happened after they arrived.
This is often where organizations uncover opportunities they didn’t expect.
A utilization study might reveal that meeting rooms appear fully booked every day, yet occupancy sensors show many sit empty because reservations aren’t canceled. Another office may have hundreds of available desks but not enough quiet spaces for focused work. Neither issue becomes obvious from occupancy data alone.
Instead of asking whether employees are in the office, utilization asks questions like:
- Which spaces are used consistently?
- Which areas remain underused?
- Are employees choosing the spaces the workplace was designed to provide?
- Does the current layout support the way teams collaborate today?
The answers often challenge long-held assumptions.
It’s not unusual for organizations to discover they don’t have too little office space. They have too much of the wrong kind of space.
The metrics that matter most
Every workplace has different priorities, so there isn’t a universal scorecard for measuring success. Still, a handful of metrics consistently provide the clearest picture of workplace performance.
Average occupancy and utilization help establish baseline demand, while peak utilization highlights when specific spaces experience their highest levels of activity. Desk utilization and meeting room utilization reveal whether different space types are aligned with employee needs, and reservation no-show rates can expose opportunities to improve booking policies.
What’s more important than any individual metric is how they’re interpreted together.
A conference room that’s booked 90% of the time may sound like a success until sensor data shows half those reservations never result in meetings. Likewise, moderate occupancy isn’t necessarily a problem if employees can consistently find the workspaces they need and the office supports productive work.
Viewed together, occupancy and utilization move beyond reporting. They become a way to understand how well a workplace supports the business.
And that’s where the conversation becomes more strategic. Once you know how employees are using your space, the next question isn’t what happened? It’s what should you do next?
Turning workplace data into better real estate decisions
The value of occupancy and utilization metrics isn’t in the dashboard. It’s in the decisions they support.
Once organizations have reliable workplace data, the conversation usually shifts away from reporting and toward planning. Should a lease be renewed? Does this office need fewer desks or a different layout? Is there enough evidence to consolidate two locations? Those answers come from patterns that emerge over time, not from a single week’s occupancy report.
When it’s time to consolidate
Consolidation is often the first opportunity organizations explore, especially when reducing real estate costs is a priority. But low occupancy alone isn’t enough to justify reducing space.
A floor that appears underused may still contain the meeting rooms, training areas, or project spaces that employees rely on most. Looking only at attendance numbers can lead to decisions that save square footage but create frustration for employees who no longer have access to the spaces they need.
Instead, look for consistent trends across several months. If entire neighborhoods remain unused during peak office days, or multiple buildings serve the same workforce with similar attendance patterns, there may be an opportunity to reduce the footprint without affecting day-to-day operations.
When redesign makes more sense
Some of the most successful workplace projects don’t involve shrinking the office at all.
Organizations often discover that their biggest challenge isn’t having too much space. It’s having space designed for yesterday’s way of working.
Many offices still devote large portions of the floorplate to assigned desks, even though employees come into the office primarily to collaborate, meet with colleagues, or work with project teams. Utilization data makes those shifts visible.
One common pattern is seeing traditional workstations sit empty while small meeting rooms remain booked all day. Another is finding oversized conference rooms that are rarely filled to capacity but can’t easily be divided into smaller spaces.
Those insights point toward redesign rather than downsizing. Reconfiguring underused desk areas into flexible neighborhoods, team rooms, or quiet workspaces often delivers greater value than reducing the overall footprint.

Let data shape hybrid work strategies
Hybrid work has introduced new rhythms to the workplace, and they’re not always obvious without reliable data.
Many organizations continue to experience predictable attendance peaks during the middle of the week. That doesn’t necessarily mean they need more office space. It may simply mean employees are arriving at the same time.
Occupancy and utilization trends help workplace leaders answer practical questions, such as whether teams should coordinate in-office days, whether additional desk booking rules are needed, or whether collaboration spaces should be expanded before adding more desks.
The goal isn’t to force employees into the office on specific days. It’s to understand how the workplace is being used so policies support the way people already work.
Recognize when growth is real
Not every utilization trend points toward consolidation.
Sometimes the data shows the opposite.
If meeting rooms are consistently unavailable, employees struggle to reserve desks during peak periods, and demand continues to increase over several quarters, those patterns may indicate that the current workplace is reaching its limits.
The important word is consistent.
One busy month rarely justifies expanding an office. Sustained demand, supported by occupancy and utilization data, provides a much stronger foundation for capital investments, lease renewals, or workplace expansion.
Avoid common measurement mistakes
Collecting workplace data has become much easier. Interpreting it correctly is still the challenge.
One of the most common mistakes is relying on a single source of information. Badge access tells you who entered the building, but not whether they stayed all day or how they used the workplace. Reservation data shows intent, but not actual occupancy. Each source fills in part of the picture.
Another mistake is designing for the busiest day of the week. Offices that feel crowded on a Wednesday may have abundant capacity on Mondays and Fridays. Making long-term real estate decisions around peak attendance often results in more space than the organization actually needs.
It’s also worth looking beyond overall utilization percentages. A building can appear healthy on paper while hiding significant imbalances between different space types. Empty desks alongside fully booked meeting rooms usually suggest a layout issue, not necessarily a space shortage.
Perhaps the biggest mistake, however, is treating occupancy reports as historical records instead of planning tools. Workplace data has the greatest impact when it becomes part of an ongoing conversation about portfolio strategy rather than a report that’s reviewed once and filed away.
Connecting workplace insights to portfolio strategy
Occupancy and utilization become far more useful when they’re connected to the tools organizations use to plan and manage their portfolios.
Instead of piecing together spreadsheets from multiple systems, workplace leaders can combine desk bookings, meeting room reservations, occupancy sensors, visitor data, and digital floor plans into a single view of workplace performance.
Seeing these datasets together makes it easier to spot trends that aren’t obvious in isolation. A floor plan overlaid with sensor data, for example, can quickly highlight areas that remain underused despite appearing fully reserved. Historical reporting can show whether changes to workplace policies improved utilization or simply shifted demand elsewhere.
The ability to test future scenarios is equally valuable. Organizations can model workplace redesigns, evaluate consolidation opportunities, compare buildings across a portfolio, or assess the impact of lease renewals before making significant investments.
That moves workplace planning from reactive to proactive.
Better workplace decisions start with better insight
Occupancy and utilization metrics were once used primarily to measure workplace activity. Today, they’re helping organizations answer much bigger questions about cost, employee experience, hybrid work, and long-term real estate strategy.
The organizations getting the most value from workplace data aren’t chasing a target utilization percentage or trying to fill every desk. They’re looking for evidence. They want to know which spaces employees choose, which areas no longer support the business, and where investments will have the greatest impact.
When occupancy and utilization are measured together and reviewed consistently over time, workplace data becomes more than a collection of metrics. It becomes the foundation for smarter, more confident real estate decisions.
Frequently Asked Questions

By Jonathan Davis
As a content creator at Eptura, Jonathan Davis covers asset management, maintenance software, and SaaS solutions, delivering thought leadership with actionable insights across industries such as fleet, manufacturing, healthcare, and hospitality. Jonathan’s writing focuses on topics to help enterprises optimize their operations, including building lifecycle management, digital twins, BIM for facility management, and preventive and predictive maintenance strategies. With a master's degree in journalism and a diverse background that includes writing textbooks, editing video game dialogue, and teaching English as a foreign language, Jonathan brings a versatile perspective to his content creation.