Facility managers operate at the center of some of the most pressing issues in business, like cost control, efficiency, and workplace experience. Meeting these demands takes more than day-to-day problem solving. It requires disciplined measurement and actionable insights that go beyond guesswork to reveal exactly how facilities perform and how to improve them.
Key takeaways
- KPIs turn data into action. Metrics alone show activity, but KPIs reveal how well facilities perform against goals and where to improve
- Tracking the right KPIs builds efficiency. From preventive maintenance ratios to energy consumption, each KPI highlights opportunities to reduce downtime, control costs, and optimize resources
- Software makes KPI tracking manageable. Centralized dashboards, mobile tools, and automated reporting ensure facility managers always work with accurate, real-time data
That’s where key performance indicators (KPIs) make the difference. KPIs translate raw data into actionable information, helping facility managers pinpoint inefficiencies, control costs, and optimize resources.
By tracking the right set of KPIs, facility managers build a clear roadmap for continuous improvement, turning daily operations into long-term performance gains.
The difference between KPIs and metrics
Every square foot and every dollar counts, and not all numbers carry the same weight. Facility managers track countless metrics every day, but only a select few rise to the level of KPIs.
Understanding the difference is the first step to focusing on what truly drives efficiency, cost savings, and workplace success.
- Metrics are individual data points. They tell you what happened, but not whether it matters in the bigger picture. For example, a single number like “50 work orders completed this month” is a metric.
- KPIs transform those numbers into context. They measure performance against goals. A KPI might track the “percentage of preventive maintenance work orders completed on time,” which speaks directly to efficiency and strategy.
Although metrics are sometimes included in KPIs to create plans for meeting goals, KPIs are more in-depth and give clear views of how to achieve them. KPIs help managers identify their weak points, enabling them to find a solution that works and get back on track faster.
For example, a budget metric is just a simple data point that shows how much you spend on maintenance, resources, or other assets. A budgetary KPI shows you how much of your budget you’re actually spending on those assets and gives you a clear picture of how much is wasted or how much to extend.
This is where a modern maintenance platform helps you reduce the amount of work you have to do. Instead of gathering all the data, putting it into a spreadsheet, and trying to analyze it, you already have all the necessary information gathered and stored.
Essential KPIs for facility managers
The right KPIs show where resources are working hard, where costs are creeping up, and where the workplace experience can improve.
The KPIs below give facility managers a clear, balanced view of efficiency, cost control, and service quality.
Work order backlog
Definition: The number of maintenance tasks waiting to be completed.
Why it matters: A backlog offers a snapshot of your team’s workload. A moderate backlog shows upcoming planned work. But when backlogs grow too large, critical maintenance slips through the cracks, leading to costly downtime. Conversely, a zero backlog may suggest poor visibility into what actually needs getting done or you have way too many people on staff.
Example: In a manufacturing plant, overdue safety inspections may delay compliance and risk fines. In hospitals, HVAC backlogs could compromise air quality and patient comfort.
How to track it: Modern maintenance platforms organize work orders by criticality, due date, and asset type. Real-time dashboards flag overdue tasks, while mobile tools let technicians close work orders on the spot, keeping managers up to date on progress.
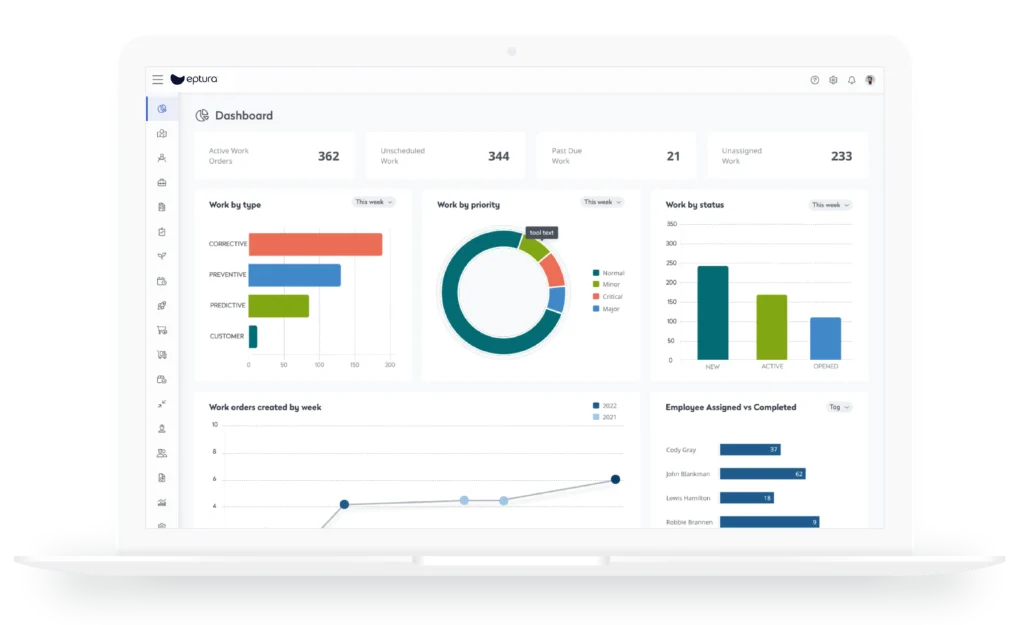
Planned vs. reactive maintenance ratio
Definition: The percentage of preventive or planned maintenance compared to reactive, emergency work.
Why it matters: A higher percentage of preventive maintenance keeps assets reliable, reduces downtime, and lowers costs. Too much reactive work often signals inefficiencies that erode budgets.
Example: A university found that 70% of its work orders were reactive repairs. By using preventive scheduling tools, the campus shifted toward proactive maintenance, reducing emergency breakdowns and cutting overtime costs.
How to track it: Reporting functions categorize work orders automatically and display planned versus unplanned ratios in visual charts. Preventive schedules can be set to recur automatically, helping teams stay ahead of inspections and servicing.
Average work order completion time
Definition: The average time it takes to close a work order from creation to completion.
Why it matters: Long completion times highlight workflow bottlenecks, training gaps, or underperforming equipment. Benchmarking completion times helps uncover and resolve issues quickly.
Example: An office facility discovered plumbing repairs consistently took three times longer than other work orders. Analysis revealed delays in vendor response protocols, which were streamlined to save time.
How to track it: Digital systems timestamp work orders from creation to close. Built-in analytics calculate average times by team, asset, or work type. Workflow automation routes requests to the right technician immediately, reducing delays.
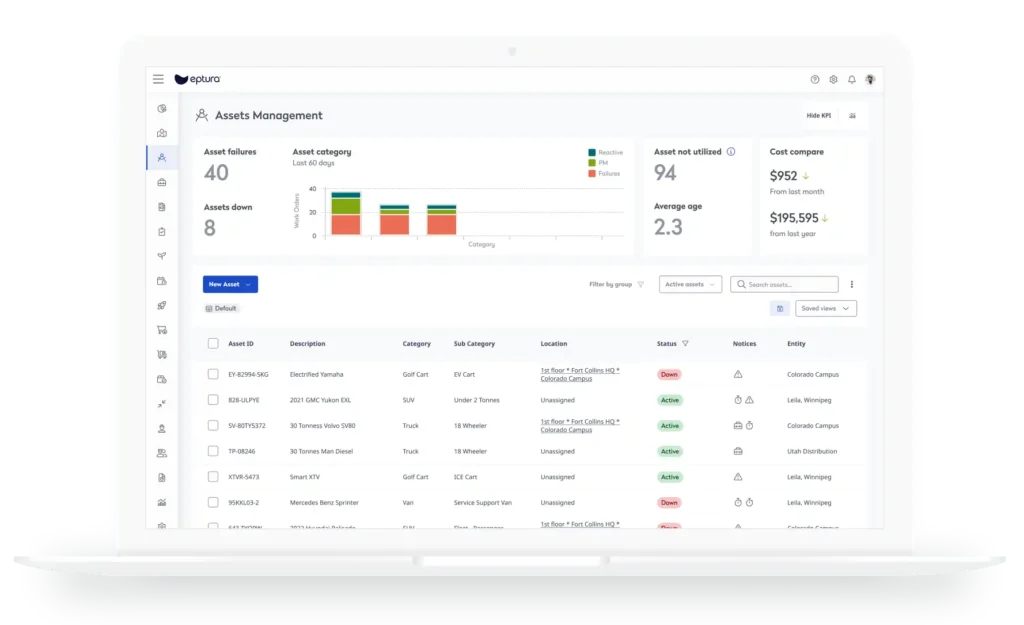
Asset downtime
Definition: The percentage of time a critical asset is offline due to breakdowns or maintenance.
Why it matters: Downtime disrupts productivity, customer experience, and revenue. Monitoring this KPI helps managers prioritize maintenance where it matters most.
Example: In a logistics warehouse, downtime on a conveyor belt for even a few hours can delay shipments and cost thousands in penalties.
How to track it: Asset management platforms log downtime events and durations automatically. Dashboards visualize downtime trends, helping managers spot underperforming equipment and make repair-or-replace decisions. IoT integrations can trigger work orders instantly when assets stop functioning.

Maintenance cost per asset
Definition: The total maintenance spend for an asset over a given period.
Why it matters: This KPI helps managers decide whether to continue repairing an asset or invest in a replacement. It also supports long-term capital planning by showing true lifetime costs.
Example: A hotel tracked high maintenance expenses for a commercial laundry unit. Data revealed repairs had already cost more than 70% of the replacement price, prompting approval for a new machine.
How to track it: Reporting tools consolidate labor, parts, vendor invoices, and service history for each asset. Comparison views highlight assets that drain budgets, guiding smarter investment decisions.
Energy consumption per square foot
Definition: The amount of energy used per square foot of facility space.
Why it matters: Energy is a major operating expense. Monitoring this KPI identifies inefficiencies, supports sustainability goals, and ensures compliance with ESG reporting standards.
Example: A large office building found one wing used far more energy per square foot than others. Adjusting HVAC schedules and upgrading lighting cut utility costs by 12%.
How to track it: Many platforms integrate with smart meters and building management systems. Dashboards show energy usage trends over time, while automated alerts flag unusual spikes that may indicate equipment problems.
Space utilization rate
Definition: The percentage of workspace actively used compared to the total available space.
Why it matters: Space is costly, and underutilized rooms represent wasted overhead. Tracking utilization ensures organizations maximize value from their real estate.
Example: A financial services firm discovered only 40% of meeting rooms were regularly used. They consolidated space and converted underused rooms into collaborative zones, reducing lease costs.
How to track it: Occupancy data from sensors, booking systems, or badge swipes feeds into utilization dashboards. Heat maps highlight usage patterns, helping managers redesign layouts or adjust leasing strategies.
Budget variance
Definition: The difference between planned budget and actual spending.
Why it matters: Financial accuracy is essential to operations. Variances expose areas where costs exceed expectations and allow managers to adjust plans before overruns occur.
Example: A hospital noticed HVAC expenses consistently exceeded budget. By analyzing cost variance data, managers uncovered recurring vendor charges tied to outdated equipment and justified an upgrade.
How to track it: Centralized financial dashboards update records in real time. Managers can drill into categories like utilities, labor, or contracted services to spot where budgets are being exceeded.
Response time to critical work orders
Definition: The time between when a critical work order is submitted and when work begins.
Why it matters: Faster responses reduce risks and keep operations running smoothly. Delays often point to staffing shortages or unclear escalation processes.
Example: A school district cut average HVAC response times from six hours to two by using mobile alerts and automated escalation rules, minimizing classroom disruptions.
How to track it: Mobile-enabled tools notify technicians immediately when a critical work order is created. Automatic tracking records the time between request and assignment, building benchmarks for continuous improvement.
Customer or employee satisfaction scores
Definition: Feedback from building occupants or stakeholders about the quality of facility services.
Why it matters: Facilities directly impact workplace experience. High scores reflect quality service, while low scores point to areas needing attention.
Example: A corporate HQ improved satisfaction ratings after restroom cleaning schedules were adjusted in response to survey feedback.
How to track it: Feedback surveys can be integrated into maintenance workflows. Dashboards compile ratings and comments, allowing managers to connect service quality with operational data.
Using software and KPIs to improve facility operations
Tracking KPIs is more than a reporting exercise. When used strategically, they drive measurable improvements across facility operations.
- Identify weak spots: Trends in completion times or response times reveal bottlenecks
- Guide resource allocation: Backlog and downtime metrics show where additional staff or funding may be needed
- Support financial planning: Budget variance and cost-per-asset KPIs provide the evidence finance teams need to approve investments
- Enhance sustainability: Energy and space utilization KPIs tie operational performance to organizational goals
- Strengthen accountability: Satisfaction scores and preventive maintenance ratios demonstrate value to leadership and stakeholders.
Smarter KPI Tracking with Modern Maintenance Software
Modern maintenance software makes tracking KPIs far more manageable and insightful. Instead of manually gathering data from spreadsheets, facility managers can access centralized dashboards, mobile reporting, and automated analytics that give them a clear view of performance at any time. This ensures that decisions are based on real-time, reliable information rather than outdated or incomplete reports.
Centralized Dashboards for Easy Oversight
With all metrics in one place, facility managers no longer need to sift through multiple reports or systems. Centralized dashboards provide a single source of truth for KPIs, allowing teams to quickly identify trends, compare performance against benchmarks, and spot areas for improvement.
Benefit: Saves time and reduces reporting errors by consolidating information into a single, intuitive view.
Mobile Reporting for On-the-Go Insights
Whether in the office, on-site, or traveling between locations, mobile access ensures facility managers can track KPIs in real time from any device. This mobility keeps teams agile and responsive, with instant visibility into maintenance response times, energy usage, and asset performance.
Benefit: Increases flexibility and responsiveness, enabling faster decision-making.
Automated Analytics for Data-Driven Decisions
Instead of crunching numbers manually, automated analytics highlight patterns, detect anomalies, and even provide predictive insights. For example, the software can flag rising costs per asset or identify underperforming equipment before it becomes a bigger issue.
Benefit: Reduces human error and supports proactive maintenance strategies that extend asset life and cut costs.
Continuous Improvement Made Simple
The result is a continuous improvement loop: measure → analyze → optimize → repeat. With every cycle, facility operations become more efficient and aligned with organizational goals. By tracking KPIs in this structured way, managers not only solve today’s challenges but also build long-term success.
Turning KPIs into long-term success
Facility managers who thrive will be the ones who don’t just track numbers, but act on them. By focusing on the right KPIs, from maintenance response times to energy efficiency, they gain the power to anticipate issues, control costs, and elevate the workplace experience.
These insights don’t just solve today’s challenges; they build the foundation for resilient, future-ready facilities that can adapt and succeed no matter what comes next.
Frequently asked questions
By Amanda Meade
Amanda Meade is a content creator at Eptura, specializing in workplace experience, meeting productivity, and emerging trends in workspace planning and visitor management. With a background in content marketing and SEO, she crafts clear, actionable content that helps teams work smarter through in-office collaboration. Throughout her career, Amanda has worked across industries, including home services, healthcare, real estate, and SaaS, developing a unique ability to distill complex topics into practical insights.