

Hybrid work has been around long enough that many organizations have developed a picture of what a typical office week is supposed to look like. Employees come in on certain days, desk-sharing ratios account for lower attendance, and collaboration happens when teams overlap. If the office gets busier, the assumption might be that more space is needed.
Actual workplace behavior does not always follow those assumptions.
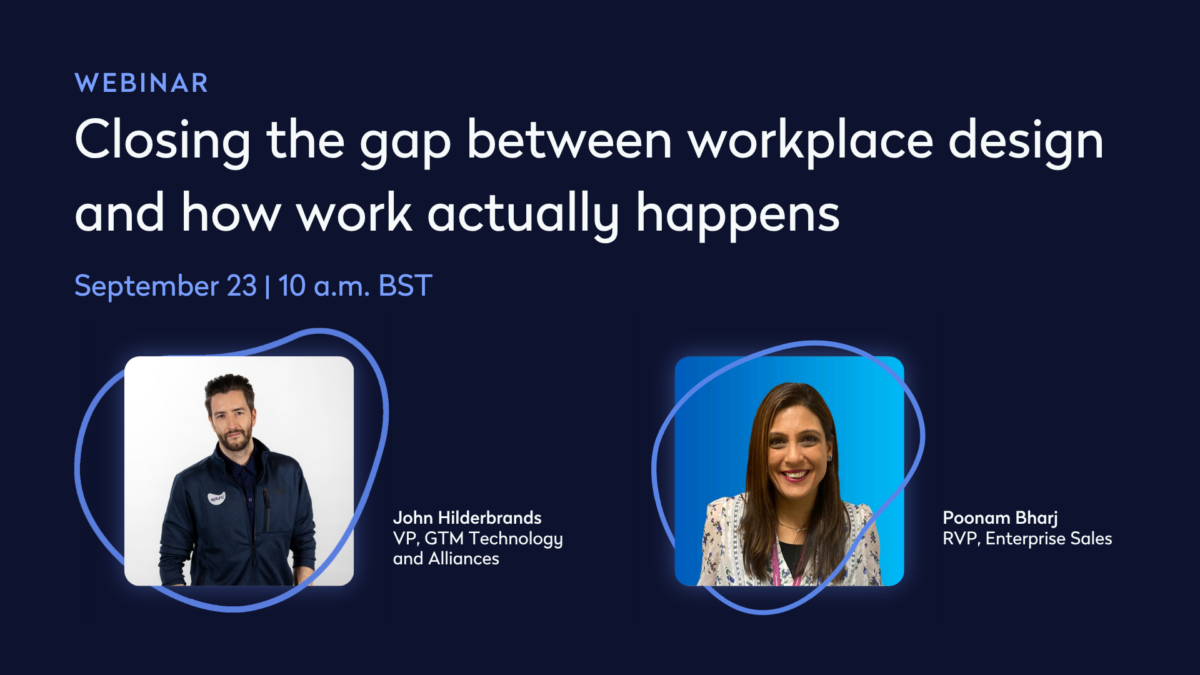
During the webinar Closing the Gap Between Workplace Design and How Work Actually Happens, Eptura workplace experts discussed patterns they are seeing across customer environments. One theme came up repeatedly, and it’s that workplace planning becomes more useful when organizations compare what they expect employees to do with what actually happens once people start using the space.
Occupancy is part of that picture, but it is only the starting point. Organizations also need to understand when employees come in, how patterns differ between teams, what brings people into the office, and whether the available space supports what they are there to accomplish.
Key Takeaways:
- Workplace assumptions should be tested against actual behavior. Attendance patterns, space demand, and employee preferences can differ significantly from what policies, surveys, or conventional hybrid schedules suggest
- Average occupancy does not tell the whole story. Peak attendance and demand for specific spaces can reveal capacity pressures that overall utilization rates may hide
- Different employees use the office for different reasons. Team collaboration, focused work, client meetings, events, and planning sessions can create very different patterns of workplace demand
- More data is not automatically better data. Organizations need consistent measurement periods and connected workplace systems to distinguish recurring behavior from temporary fluctuations
- Occupancy data can support more confident real estate decisions. Understanding both peak and average utilization gives workplace and CRE teams a stronger foundation for evaluating space requirements, consolidation, growth, and workplace design.
| Workplace assumption | What actual behavior can reveal |
| Tuesday through Thursday are always the busiest office days | Attendance patterns can vary by organization, team, and purpose, with some employees using Mondays for planning or Fridays for focused work |
| Average attendance determines how many desks are needed | Employees often concentrate attendance on the same days, creating peak demand that averages can hide |
| Low occupancy means there is too much space | Overall occupancy can be low while meeting rooms, phone booths, or collaboration areas remain in high demand |
| Employees use the workplace in roughly the same way | Some employees come in regularly for team collaboration, while others make fewer visits centered on clients, workshops, or larger events |
| Employee surveys predict future attendance | What employees say they plan to do can differ from their observed workplace behavior |
| More people in the office means more desks are needed | Employees may need meeting rooms, private spaces, collaboration areas, or client-facing spaces instead |
| More workplace data leads to better decisions | Disconnected systems and short measurement periods can make the picture less clear rather than more accurate |
| Employees need mandates to increase attendance | The experience, technology, people, and spaces available in the office can influence whether the commute feels worthwhile |
Assumption: Hybrid work patterns are still changing dramatically
Return-to-office policies continue to change, which can make workplace attendance feel unpredictable. Organizations may hesitate to make long-term space decisions because they expect the next policy or mandate to significantly change occupancy.
The patterns discussed during the webinar suggest a more nuanced picture. Looking across Eptura customer data, the speakers noted that office presence has remained relatively consistent in Europe and APAC, while attendance has been increasing in the U.S.
Greater stability gives workplace teams something useful to work with: a baseline.
Consider an office that reaches 60% occupancy at its busiest but averages closer to 30%. Those numbers provide two different pieces of information. The peak shows how much capacity is needed during periods of concentrated demand, while the average provides a broader view of how frequently the overall workplace is being used.
Both can inform decisions about leases, consolidation, growth, and changes to existing space.
The measurement period matters, too. Looking at a single week could create a misleading picture if it happens to coincide with a school break, holiday, company event, or another unusual circumstance. Comparing several periods can help separate recurring behavior from temporary fluctuations.
Assumption: Tuesday through Thursday tells you everything about hybrid attendance
Tuesday, Wednesday, and Thursday have become shorthand for the hybrid office week. While that pattern may appear in many workplaces, assuming it applies everywhere can obscure what employees are actually doing.
One customer discussed during the webinar found that employees liked coming in on Monday to plan the week with their teams. Friday can serve another purpose, particularly for employees looking for a quieter commute or office environment.
Patterns can become even more varied when organizations look below company-wide averages.
One department might benefit from an anchor day because its work depends on cross-functional collaboration. Another may have little reason to follow the same schedule. Some employees may also change their attendance around projects, workshops, client meetings, or other activities.
Instead of planning around a universal “busy day,” organizations can look at when demand actually occurs and which teams or activities are driving it.
Assumption: What employees say they’ll do predicts what they’ll actually do
Employee feedback can tell workplace leaders what people want, where they experience frustration, and what they believe would improve their workday. But stated intentions and observed behavior are not always the same.
An employee might expect to work from the office three days each week and eventually settle into a different routine. A team might request one type of space but regularly use another. Attendance can also shift around projects, meetings, commuting conditions, and personal schedules.
That does not make employee feedback less valuable. It means organizations need another layer of evidence.
Surveys help explain employee sentiment and intent. Occupancy and utilization signals show what happens in practice. Comparing the two can reveal gaps that would be difficult to identify from either source alone.
Assumption: Average attendance determines the right desk ratio
Desk-sharing ratios can look straightforward on paper.
If employees spend only part of the week in the office, a 2:1 employee-to-desk ratio may appear to provide enough capacity. The calculation becomes more complicated when employees choose the same office days.
Two employees may each average two days in the office, for example. If both choose Tuesday and Wednesday, the workplace can still experience a desk shortage even though average weekly attendance suggests there should be plenty of capacity.
That is why aggressive desk-sharing ratios can make completely unrestricted free addressing difficult. Average attendance does not show how concentrated demand becomes at particular times.
Anchor days, workplace scheduling, reservations, and team coordination can help manage those peaks. More importantly, actual utilization patterns can show whether the ratio that worked in a planning model still works when employees begin using the space.
Assumption: More people in the office means you need more desks
Headcount and desk demand are not interchangeable.
Employees come into the workplace for different reasons, and those reasons influence what they need once they arrive. Someone coming in for focused individual work creates a different type of demand than a team running a workshop, employees gathering for a product launch, or a group hosting an important client meeting.
A fuller office may increase demand for desks, but it can also increase demand for phone booths, small meeting rooms, larger collaboration areas, and client-facing spaces.
That makes purpose an important part of workplace analysis.
Instead of stopping at “How many people were here?”, workplace teams can ask:
- Which teams were present?
- What brought them into the workplace?
- Which types of spaces did they use?
- Where did demand exceed availability?
- Which spaces remained consistently underused?
Those answers can change the response to an apparent capacity problem. An organization may not need additional square footage at all. It may need to change how its existing space is configured.
Assumption: Low occupancy means you have too much space
Average occupancy can also be misleading when it is separated from space-level utilization.
A building could have relatively low overall occupancy while employees struggle to find meeting rooms, phone booths, or collaboration areas. From an employee’s perspective, the workplace feels full even though there is technically plenty of unused capacity elsewhere.
The opposite can happen as well. A workplace may appear busy while significant areas remain underused because the spaces available do not match what employees came in to accomplish.
Before assuming that higher demand requires additional real estate, organizations can examine how existing space is performing. More phone booths for short private calls, a different mix of small and large meeting rooms, or better collaboration areas may solve a problem that total occupancy figures alone cannot explain.
Occupancy shows how many people are present. Utilization adds another layer by showing how particular spaces are actually being used.
Assumption: Employees need a mandate to make the commute worthwhile
One of the more interesting customer examples from the webinar came from a large financial organization. Instead of focusing solely on requiring employees to return, the organization concentrated on making its spaces “justify the commute.”
That changes the question from whether employees are present to what they gain by being there.
Employees may already have productive home environments with reliable technology, comfortable workspaces, and familiar routines. Coming into the office therefore needs to serve a purpose.
That purpose will not be identical for everyone. It could be working alongside colleagues, participating in a workshop, meeting with a client, or having access to better meeting technology. Reliable high-speed internet, private areas for calls, and even environmental comfort can affect where employees decide to spend the day.
Understanding those reasons can help organizations evaluate whether the workplace supports the activities employees are choosing to do there.
Assumption: Every hybrid employee uses the office in roughly the same way
The webinar itself provided an example of how quickly this assumption breaks down.
One speaker described coming into the office two or three days each week and benefiting from working near colleagues they regularly collaborate with. Another might come in only two or three days a month but plan those visits around client meetings, town halls, and larger group activities.
The second employee has lower attendance frequency, but that does not necessarily mean they create less demand for workplace resources. A planned office day involving clients and multiple colleagues may require considerably more shared space than a routine individual workday.
Both are hybrid workers, but their workplace patterns look very different.
Looking at these patterns separately can provide more useful information than designing around an “average hybrid employee.”
Assumption: Workplace technology works if the tools are available
Employees have spent years improving their home working environments, and their expectations for workplace technology have changed with them.
Providing a booking system, video conferencing, or meeting-room technology is not enough if employees have to work through multiple administrative steps to use them. Finding a desk should not require navigating several systems, and the first 10 minutes of a hybrid meeting should not be spent trying to connect the audiovisual equipment.
The webinar repeatedly returned to the importance of reducing this friction.
One example involved technology recognizing an employee’s established working patterns, reserving an appropriate workspace when they entered the building, checking them in, and placing them near a colleague they needed to work with.
The value in that scenario is not technology for its own sake. It is the removal of unnecessary steps between arriving at the workplace and getting work done.
Assumption: More workplace data automatically leads to better decisions
Organizations can have plenty of data without having a clear view of workplace behavior.
During the webinar, one telecom company was described as having nine tools performing essentially the same function. Another organization involved in an RFP had 28 different systems in its environment.
When workplace information is scattered across systems, it becomes harder to establish which signals are reliable, connect related information, and understand the complete pattern.
The answer is not necessarily adding another platform or waiting until every source of data has been consolidated.
The recommendation mentioned during the webinar was to start with what is already available. Define what you are trying to understand, establish a baseline, identify the gaps, and measure consistently over time.
A smaller dataset tracked across a meaningful period can reveal more than an isolated snapshot. Organizations can begin with a building, department, or particular type of space, compare patterns, and expand the analysis as they learn more.
Move from assumptions to evidence about how work happens
There is no single occupancy percentage, desk ratio, or hybrid schedule that explains how a workplace should operate.
A 40% occupancy rate does not tell you whether employees found the meeting rooms they needed. Three office days per week does not tell you whether those days overlap with the right colleagues. Low building occupancy does not tell you whether phone booths are constantly full. And an employee survey describing intended attendance does not guarantee that employees will follow that pattern.
The more useful questions are about what happens behind those numbers. When are people actually coming in? Which teams are driving demand? What brings them into the workplace? Which spaces fill first, and which remain underused? Are employees spending time navigating workplace systems instead of getting to work?
Answering those questions means looking at attendance over meaningful periods, comparing patterns across functions, examining peak demand alongside averages, and understanding how different types of spaces are being used.
Organizations do not need to wait for perfect data to begin. Start with the signals already available, establish a reliable baseline, and compare actual behavior over time. The differences between what was expected and what employees actually do can reveal where workplace design, policies, or technology deserve another look.
Are your workplace decisions based on assumptions or what employees actually do? Watch Closing the Gap Between Workplace Design and How Work Actually Happens for the full discussion on occupancy, utilization, employee behavior, and the workplace patterns worth measuring.
Frequently asked questions

By Amanda Meade
Amanda Meade is a content creator at Eptura, specializing in workplace experience, meeting productivity, and emerging trends in workspace planning and visitor management. With a background in content marketing and SEO, she crafts clear, actionable content that helps teams work smarter through in-office collaboration. Throughout her career, Amanda has worked across industries, including home services, healthcare, real estate, and SaaS, developing a unique ability to distill complex topics into practical insights.