
Walk around any facility, campus, or shop floor, and you’ll soon see a familiar rhythm: technicians moving between locations, retrieving parts, reviewing work orders, navigating access, and then finally working on assets and equipment. That crucial “on-tools” window, wrench time, is frequently far smaller than you’d hoped. It feels like your technicians aren’t spending enough time actively adding value.
While many organizations track wrench time, though, it can fluctuate widely, misleading maintenance departments. At the same time, time on wrench does have value as a diagnostic, and avoiding the “wrench time” trap means knowing how and when to use it.
Key takeaways
- Focusing solely on wrench time can be misleading, as it overlooks crucial preparatory and supporting activities essential for safe and effective maintenance
- Shift your focus to metrics like PM compliance, schedule compliance, and rework rate for a clearer, more actionable picture of your maintenance performance
- Digital work orders, mobile apps, integrated asset registries, and smart dashboards are vital for standardizing processes, improving data quality, and driving real efficiency gains
Understanding wrench time nuance helps with transforming maintenance operations, enabling facility managers to avoid drawing the wrong conclusions and instead embrace a more effective, data-driven approach to asset management and team productivity.
What wrench time captures and what it misses
There are many drawbacks to using wrench time as a benchmark. While wrench time includes the hours a technician spends actively performing maintenance tasks, it also excludes time spent on essential activities like reading work orders, collecting parts or tools, traveling to assets, or taking mandated breaks.
While these “non-wrench” activities might seem like downtime, they are often critical for safe, effective maintenance. For example, you want your team to meticulously prepare, verify safety protocols, and pause to troubleshoot mid-task when necessary. The typical definition of wrench time often misses the value these activities add, highlighting where its measurement can go wrong, explains practitioner guidance.

When organizations attempt to measure wrench time, popular approaches like self-reports, shadowing a technician, scheduled spot checks, or work sampling often skew results and can frustrate teams.
Self-reports tend to overstate productivity, while shadowing can inadvertently alter behavior. Sampling struggles with comprehensive coverage across multiple sites, and statistical analysis requires rigorous application to avoid misleading outliers.
Consider this scenario: On a sprawling multi-building campus, chilled water pumps begin failing during the shoulder season. Initially, wrench time metrics appear favorable because technicians are spending hours at the pumps. However, the team is losing significant time retrieving parts, searching for outdated schematics, and re-doing work due to missed steps.
The real solution isn’t simply “more wrench time.” What you need is to implement standardized digital work orders that include asset-specific checklists, up-to-date diagrams, precise part lists, and critical safety notes, all accessible to technicians in the field to drastically reduce delays at the point of work and shorten repair cycles, leading to genuine efficiency gains.
How to leverage wrench time as a diagnostic tool
While the wrench time metric can be unreliable when you try to use it as a primary performance indicator, it delivers value as a diagnostic tool. You just have to think of it less as a grade on a report card and more as a symptom that points to underlying issues.
Pinpointing hidden inefficiencies
A low wrench time percentage isn’t necessarily a sign of inefficient technicians. Instead, it often indicates systemic inefficiencies.
Low wrench time numbers highlight excessive time spent:
- Waiting for parts
- Navigating complex approval processes
- Traveling between distant assets
By observing why wrench time is low in specific instances, you uncover bottlenecks that truly hinder productivity.
So, instead of just tracking the number, you can conduct targeted observations or time studies when wrench time dips unexpectedly. Categorize the “non-wrench” activities you observe, letting the granular data reveal where your team truly loses time and allowing you to address root causes rather than just lamenting the symptom.
Modern facility management software solutions help you capture this data effectively. For example, mobile work order management allows technicians to log time against specific tasks and non-wrench activities directly from their devices, providing precise data on where time goes during a job.
Integrating wrench time with broader metrics
For a complete and actionable picture, you can’t use wrench time alone. You have to pair it with other, more outcome-oriented metrics.
For example, if your wrench time is low but your Mean time to repair (MTTR) is also high, technicians spend a lot of time not wrenching, and the repair still takes too long when they finally do. Conversely, a seemingly “good” wrench time might mask frequent reworks or poor schedule compliance if technicians rush through tasks without proper preparation.
Use wrench time as a “why” metric. When you see fluctuations or consistently low numbers, cross-reference them with your MTTR, schedule compliance, and asset reliability data.
Ask yourself:
- Does a dip in wrench time correlate with a spike in MTTR? It might indicate issues with parts availability or documentation
- Does high wrench time coincide with low schedule compliance? Perhaps technicians spend too much time on reactive fixes, pulling them away from planned work
An integrated view helps you ask the right questions and target your improvement efforts effectively. Modern platforms with customizable dashboards allow you to visualize these interconnected metrics, providing a holistic view of your maintenance operations and enabling you to identify trends and make data-driven decisions quickly.
How to use wrench time to evaluate implementation effectiveness
After investing in new technologies or process improvements like digital work orders, mobile apps, or enhanced inventory management, wrench time can serve as a valuable, albeit nuanced, indicator of whether these changes truly impact technician efficiency at the point of work.
Setting realistic expectations
Approach this evaluation with realistic expectations. While the benchmark for world-class wrench time is generally 50–55%, more typical values are 18–35%, reflecting the reality of non-value-added tasks in maintenance workflows.
Your goal, though, isn’t to eliminate these essential steps. It’s to minimize unnecessary delays. Even the most streamlined operations include necessary “non-wrench” activities like safety checks, tool setup, and documentation.
So, don’t expect your wrench time to suddenly jump to 100% after an implementation. Instead, look for incremental, sustained improvements.
A significant portion of a technician’s day will always involve preparatory and administrative tasks. Benchmark your current wrench time before implementation and then measure it again after a reasonable period to assess the change.
Diagnosing post-implementation bottlenecks
If you implement new solutions designed to reduce non-wrench activities, for example mobile access to schematics, better parts tracking, but wrench time hasn’t improved as anticipated, it’s time to investigate further.
It might be the case that the new mobile app isn’t intuitive, leading technicians to spend more time navigating it than expected. Or maybe the new inventory system is in place, but teams do not follow the process for reserving parts, still causing delays.
If post-implementation wrench time remains stagnant or even decreases, it’s time to conduct follow-up observations.
Ask yourself:
- Does the new digital work order system truly reduce time spent on paperwork?
- Do technicians find parts more quickly with the updated inventory system?
Use wrench time as a feedback loop. If the numbers do not move in the right direction, your new solution might not be fully adopted, properly configured, or effectively addressing the specific inefficiencies it was supposed to solve.
From here, you can fine-tune your implementation and training strategies for maximum impact.
More practical ways FMs can boost efficiency without worrying about wrench time
For many operations, there are many more effective ways than tracking wrench time to tighten processes, improve asset uptime, and more easily make and demonstrate progress toward an effective, efficient facility maintenance management program.
Standardize preventive maintenance
Build time- or usage-based preventive maintenance plans for your high-impact assets. Standardize maintenance checklists so every technician performs the same steps consistently, and fine-tune the cadence based on observed failure patterns and operational windows. By strategically shifting work from reactive to proactive, you significantly cut unplanned downtime, mitigate risk, and ensure auditors are satisfied with clean, complete records.
A comprehensive preventive maintenance program within a modern solution allows you to set up and schedule inspections and tasks with configurable maturity charts and inventory planning, supporting both time- and usage-based triggers.
Make work orders data-rich and mobile
Move beyond cumbersome paper forms and fragmented email chains that break context. Implement configurable digital work orders that seamlessly attach manuals, diagrams, part lists, and safety notes, complete with checklists that make every step unambiguous, empowering technicians with field access to assign, update, and close jobs directly from their mobile devices.
Managers gain real-time visibility into the entire lifecycle—from initial request to close-out—and can coach teams based on accurate, real-world data. Teams can streamline end-to-end workflows with robust work order and ticketing management, supported by a technician app that functions both online and offline.
Richer work orders and mobile access dramatically reduce time lost hunting for information and significantly improve productivity at the point of work, explains uploaded guidance. The result is faster close-outs and cleaner asset histories, invaluable for audits and in-depth analysis.
Consider this scenario: Those mystery chillers stop disrupting production once work orders deliver the same consistent process every time, complete with schematics and required parts. Technicians spend less time away from the asset, repair cycles shorten, and the MTTR trend improves even if the raw wrench time percentage doesn’t dramatically shift.
Implement parts and inventory discipline
Establish optimal par levels for critical spares, track multi-site stock with regular cycle counts, and reserve inventory against scheduled work orders to ensure technicians never arrive empty-handed. Crucially, tie inventory usage back to specific assets and work orders to gain insights into lifecycle costs and vendor performance.
Modernizing this practice with advanced parts and inventory management software supports automatic assignments, multi-location tracking, audits, and accurate forecasting.
This is an area where wrench time often misleads: high “on-tools” minutes during a three-hour repair could easily mask poor planning, missing parts, or extended vendor lead times. Practitioners note that improving planning and materials management yields far greater gains than simply policing technician minutes, according to practitioner perspectives and industry analyses.
Consider this scenario: A multi-site operation consistently experiences Friday delays. Critical filters go missing, technicians wait for deliveries, and weekend overtime eats into the budget. Leaders implement a solution to set par levels for these filters, reserve them for PMs, and run cycle counts to maintain accurate inventory. Emergency orders plummet, schedule compliance rises, and occupied spaces remain comfortable. The rework rate falls because teams consistently use the right parts the first time.
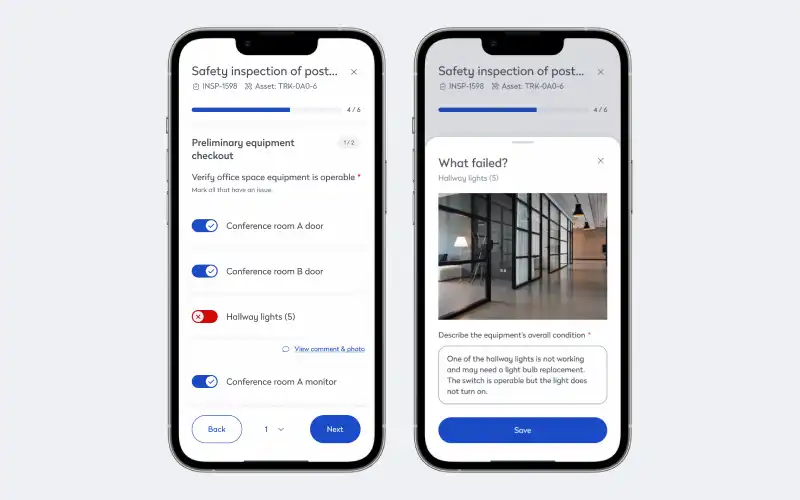
Turn visual inspections into structured, digital signals
Your technicians already use their eyes, ears, and hands to catch early signs of potential issues along the P-F curve. Empower them with standardized digital inspection templates, requiring clear pass/fail signoffs, and automatically generate work orders for any identified defects.
Over time, the patterns of failed checks provide invaluable data, indicating where to adjust PMs or invest in targeted training. You can implement this with inspection workflows and guidance that demonstrates how modern tools transform routine checks into insights.
It’s a framework that actively encourages the use of standardized metrics and procedures to convert field observations into reliable data that you can leverage into action.
Build an integrated asset picture
Create a comprehensive asset registry that includes full life cycle history, warranty status, and failure codes, all meticulously mapped to floor plans and equipment locations. During capital planning or portfolio changes, the integrated view allows teams to accurately assess deferred maintenance, prioritize critical systems, and schedule work with minimal disruption to occupants.
A modern facility management solution with asset management tools makes it significantly easier to visualize assets, track their lifecycles, and connect maintenance activities directly to reliability analytics.
Implement customizable dashboards
When leadership asks for a progress report, the answer shouldn’t be a scramble through spreadsheets or anecdotal evidence. Instead, it should come from a robust system equipped with intuitive dashboards.
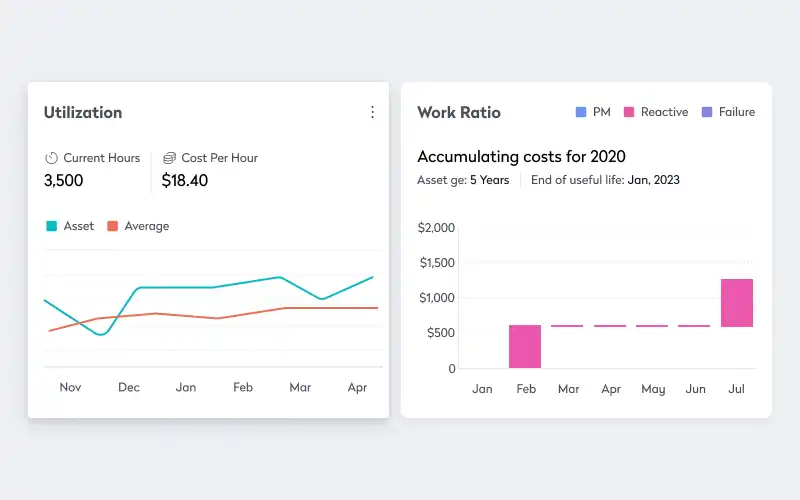
Dashboards are essential for facility managers, especially within large enterprises, as they provide a “big picture” view by consolidating disparate data into a single, easily digestible format, helping you quickly grasp performance, identify trends, and make data-driven decisions without getting lost in the numbers.
These tools help you transform raw data into strategic insights, making it easier to communicate progress, justify investments, and continuously improve maintenance efficiency across the entire operation. By leveraging them, you can finally move from confusion to coordination, ensuring every decision is backed by clear, actionable data.
How to help maintenance teams work smarter, not harder
By focusing on clear, outcome-driven KPIs, implementing practical strategies like standardized preventive maintenance, leveraging mobile-friendly work orders, and getting serious about parts and inventory, facility teams can truly transform their operations.
When all this comes together, powered by the clear insights from well-designed dashboards, you’re able to build a more reliable, efficient maintenance environment.
Frequently asked questions
By Jonathan Davis
As a content creator at Eptura, Jonathan Davis covers asset management, maintenance software, and SaaS solutions, delivering thought leadership with actionable insights across industries such as fleet, manufacturing, healthcare, and hospitality. Jonathan’s writing focuses on topics to help enterprises optimize their operations, including building lifecycle management, digital twins, BIM for facility management, and preventive and predictive maintenance strategies. With a master's degree in journalism and a diverse background that includes writing textbooks, editing video game dialogue, and teaching English as a foreign language, Jonathan brings a versatile perspective to his content creation.