
As part of their search for the best balance between work models, companies are looking more closely at occupancy and utilization. These are powerful metrics, and as corporate real estate (CRE) consultants, we know there’s a variety of reasons companies should be focused on them. For many organizations, it’s still early days in the process, but we’re encouraged by the increasing interest and growing understanding that they need to see these metrics not in isolation but within a larger context.
Working definitions of occupancy and utilization data
Although we often hear people using “occupancy” and “utilization” interchangeably—and it’s something we sometimes do ourselves—there are important differences between these two terms. On the most basic level, occupancy is how many people a space is designed for or used by, while utilization is how people use that space at a specific time or within a timeframe.
Looking at them more closely, though, there are three facets to the two metrics, each connected to a specific way of capturing data. While bookings reveal what should happen, those numbers only reflect intention. To see what really happened, you need to look at badge data, which tells you how many people showed up. That can only tell you so much, though. To understand where people went and what they did, you need sensor data.
Each of these aspects shows a different side of what’s happening in your spaces. For a more complete picture, you need to also look at employee feedback and experience, which includes understanding how the space works for the activity it was designed for as well as who uses it.
The rise of occupancy and utilization as key metrics
Not only are occupancy and utilization separate – but related – metrics; we’re now beginning to see them evolve. Understanding these distinctions is crucial in the post-2020 work environment in which these indicators are now moving targets, with weekly, monthly, and seasonal variations. These fluctuations have made understanding occupancy and utilization much more important.
We saw this new way of thinking about the metrics captured in two separate interactions in the same week this month. One organization we’re working with said their leadership never used to worry about occupancy, while another shared that occupancy and utilization were now key reportable metrics across many of their teams. These examples represent a trend we’re seeing with wide applicability across industries.
Another important shift we’re seeing is senior leadership now asking to see these numbers monthly or even every other week. It’s a trend captured in an insight a facility management provider once shared with us: “We used to have to convince leadership this software existed. Now they’re coming to us and saying, ‘We need help with this.’”
Companies want to leverage the metrics, but for different goals
Industry-wide, we’re seeing businesses embrace one of two approaches. Either they’re looking at employee behavior so they can tailor facility operations to match demand, or they’re using the metrics as part of larger campaigns designed to directly influence when and how often employees are in the office.
For example, a company that’s decided on or defaulted to an employee-led hybrid model may want to understand peaks and troughs so it can respond by adjusting available space to match organic demand. If Fridays usually have less traffic, they might open only a few floors. On Wednesday, when it’s busier, they may allow employees access to spaces throughout the facility. We’re also seeing companies using data to find opportunities to repurpose or sublet spaces on low-occupancy days.
Other companies are taking a different approach, using occupancy and utilization as proxy metrics to track the results of other efforts. There are many possible reasons organizations want people back at their office desks. The CEO might feel employees need more oversight from their managers. Or the company might be more interested in changing when their hybrid employees are in the office. This may mean they’re not worried if the office is empty Mondays and Fridays. Instead, they’re concerned that so many people are showing up on Wednesdays it’s degrading the overall office experience. Tracking occupancy can help them understand how effectively their policies flatten the midweek mountain.
Our experience matches what has already been widely reported about the prescriptive approach. Getting people back to the office on certain days with “rewards” only works for a while. Free coffees, group lunches, and after-work drinks with coworkers all eventually lose their appeal. Companies see more success when they directly connect time in the office to existing workflows. For example, they can schedule regular team meetings, lunch-and-learns, and kickoffs on days with lower occupancy numbers.
How to put occupancy and utilization into perspective
Many of the companies we’ve worked with are still in the early stages of finding ways to capture and leverage workplace and facility data that work best for them. From the start, we always tell them that both are important metrics, but you need to see them in a larger context to get actionable insights.
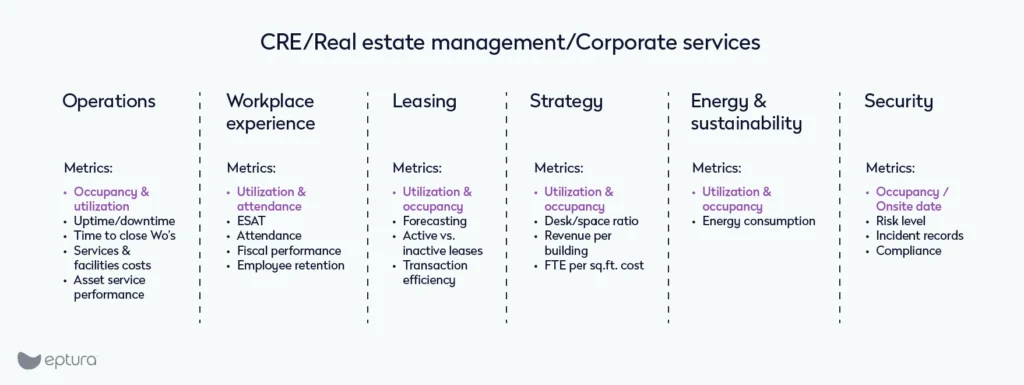
Capturing occupancy and utilization has value for many teams
Many different teams may want to use this data, so when organizations standardize on a digital system to automate collection of accurate occupancy and utilization data, they can see a strong return on investment. In fact, occupancy and utilization are some of the few metrics with broad cross-team appeal.
Interestingly, we’re seeing the direction of rightsizing differ between countries. Although there’s been a lot of news recently about U.S. federal agencies reducing their real estate portfolios, work has largely returned to the office in India, and the companies we speak with who have staff there are looking to expand their footprints. Accurate occupancy data will help ensure these companies have productive spaces without overextending.
Beyond portfolio planning, a workplace experience team can leverage the same numbers to level attendance throughout the working week or better match layouts to employee onsite behavior. If meeting rooms consistently see higher utilization numbers than individual desks, it may make sense to include more spaces for group work.
Metrics only make sense in context
Businesses can run into problems when they try to see occupancy and utilization in isolation or as absolutes. Depending on the organization, low utilization may not be an issue.
We recently worked with a team that only comes into the office about once a month, which matches the nature of their work and position in the organization. They generally only work with one another, and when they need to work with other departments, they rely on established relationships and institutional knowledge.
According to the team’s director, the situation is different for employees with less time at the company. They need and want to be in the office more often because it helps them develop their professional knowledge and networks.
Within the same company there are vastly different data sets between groups, but neither indicates a problem. Instead, they reflect the different ways teams use spaces to best match a variety of factors. The metrics matter, but never absolutely. Context is key.
To begin your own digital journey, connect with our consultancy.
By Erik Zink and Sarah Kilmartin
Erik Zink, Vice President Worktech Consultancy and Corporate Development, has more than a decade of experience as a strategy and transformation consultant. He is an expert on change and strategic growth and has advised Fortune 500 enterprise leaders on large scale implementations and transformations. Sarah Kilmartin, Director of Customer Insights, has more than two decades of experience managing enterprise customers and supporting global departments through workplace transformations. As a former facility and operations leader for a leading flex space provider, she’s an expert on workplace strategy, qualitative and quantitative thought leadership, and customer insight.