Key takeaways
- MTBF measures asset reliability and informs repair-or-replace decisions. A longer MTBF indicates better reliability, while a lower MTBF can signal end-of-life issues, operator error, or maintenance gaps.
- Accurate MTBF calculations depend on clear definitions and consistent data. Only include repairable asset failures, exclude scheduled downtime, and track operational hours precisely.
- Maintenance software improves MTBF results. Digital tools standardize work orders, streamline inventory control, and schedule preventive maintenance based on historical performance data.
Mean time between failures (MTBF) is a measure of an asset’s reliability. It shows you how long, on average, an asset can run before you need to repair it. On a basic level, you can use MTBF as a maintenance key performance indicator (KPI) to see how well your team maintains assets. But you can also use MTBF to improve your operations, including tightening inventory control and fine-tuning your preventive maintenance program.
What is the definition of mean time between failures?
Mean time between failures is the amount of time, in hours, that an asset can run before it fails and the maintenance team needs to repair it. And the word “repair” is key here: You only calculate MTBF for assets you can fix. For things that you can only ever replace, for example light bulbs, you use a different maintenance metric.
To get a better sense of what MTBF can tell us about our maintenance operations, it’s worth untangling the relationships between MTBF, reliability, and availability.
MTBF is closely connected to an asset’s reliability and is a part of the reliability equation: Reliability = e(time/MTBF). That means the longer your MTBF, the higher your reliability. A longer MTBF also improves your availability.
But what’s the difference between reliability and availability? Reliability is the probability an asset or piece of equipment can perform without failures. Availability is the probability an asset or piece of equipment can perform at any given time. When you calculate availability, you need to consider its reliability and the amount of time the maintenance team takes to get it back up and running after a failure.
Why does MTBF have so many different other names?
Not all failures are equal, so MTBF has more than one variation, each with a different definition of failure.
For example, there are complete failures, where the equipment is down, and the maintenance team needs to repair it before it can go back online. Think of a car with a flat tire. But there are also partial failures, where the equipment is still working but not at full capacity. Think of a car with a bad muffler; you can still drive it. A car with a broken radio antenna? That one component has failed completely, but the car runs fine, and you might not even notice the failure until you try to turn on the radio.
It’s tempting to think of those different failures as existing along a spectrum that moves from bad to worse. But There are situations where a complete failure is better than a partial failure. In a manufacturing setting, for example, the advantage of the line going down is that you know right away that there’s a problem. With a partial failure, it might be large enough to affect the quality of your output but also small enough to go unnoticed.
How to calculate mean time between failures
Start by tracking three numbers:
- Total number of hours the asset was in operation
- Number of times it failed
- Total hours it took to repair after each failure
Then take the total number of hours of operation (hours running minus the hours it was down and being repaired) and divide it by the total number of failures.
Don’t worry about downtime related to preventive maintenance work. In fact, don’t include any time the asset was scheduled to be offline. For example, if your manufacturing plant is only running one shift, a press might only be scheduled to be online eight hours a day. Over the course of three days, that’s 24 hours, not 72.
Make sure you have a good definition of “online,” too, because it’s different for different assets. Take a hydraulic press, for example. Is it online the whole time it’s simply on? Or is it only online when it’s applying force? Another example is a forklift. Do you include all the time it’s on or only the times it’s carrying a load?
Whichever you decide, make sure you’re consistent.
How to use the MTBF formula
Let’s look at a simple example. Say you have a motor that runs for 24 hours. During that time, it failed twice. Each time it took the team an hour to fix.
The motor ran for 22 hours (24 hours minus the two hours it took for repairs). Twenty-two divided by two, the total number of failures equals 11.
Not a great asset. On average, it’s going to fail every 11 hours. That’s not good. Is it time to look for a new one?
Why use MTBF software
Have you already thrown out that press? It might not have been the right decision.
In some cases, a low MTBF means it’s time to retire an asset and bring in a replacement. If an asset has been generally reliable but is now presenting more problems, it might be close to the end of its useful life. But this is not always true.
A low MTBF can also come from operator error and poor maintenance practices. It’s failing because of how the operators are running it and how the technicians are trying to keep it up and running.
The first thing to check is that operators aren’t abusing the equipment. If they are, you need to determine if it’s from ignorance or indifference, and then take the appropriate steps. If it’s not operator error, you can start to look at your preventive maintenance software for ways to streamline and strengthen workflows.
With the right digital solution, you can improve your maintenance programs, boosting your maintenance metrics and key performance metrics (KPIs), including MTBF.
Standardized work order processes and procedures
With a team of techs, you can’t always have the same person maintaining and repairing the same assets and equipment. If you tried, you’d have little flexibility in your scheduling. What you need is a system in place to ensure every tech does the work the right way, every time.

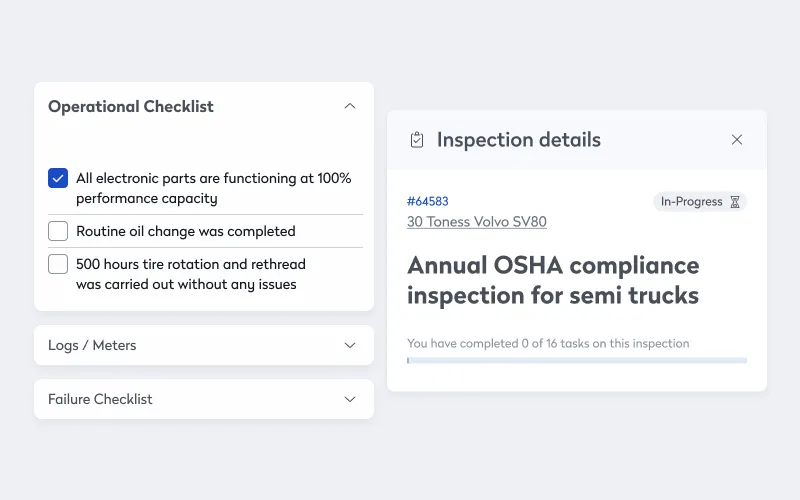
With MTBF software, assigning work orders is easier and more consistent. Instead of trying to scribble notes onto an easy-to-lose slip of paper or get everything into spreadsheet cells, modern work order management solutions make it easy to give techs everything they need to work fast and consistently, including:
- Comprehensive maintenance and repair histories
- Step-by-step instructions
- Customizable checklists
- Digital images, schematics, and manuals
- Associated parts and materials
Now, instead of techs relying on trial-and-error troubleshooting and plain guesswork, they have instant access to your current best practices.
Balanced inventory management and control
Once you know your MTBF for an asset, it’s a lot easier to look at lead times and set inventory par levels.
When you know that one of your presses tends to break down once every three weeks, you can more easily plan which parts and materials you’re going to need and when. If the press tends to need a new bolt, washer, or spacer, you can make sure you have them on hand by looking at your current levels and lead times.
With the right software solution, most of this process is automatic. Set your current and par levels in the software, and every time you close out an on-demand or preventive maintenance work order with that part or material, the software subtracts it from your current levels. When you hit the par level, the software sends you a message letting you know it’s time to reorder. It can even automate some of the purchasing steps.
Perfectly timed preventive maintenance inspections and tasks
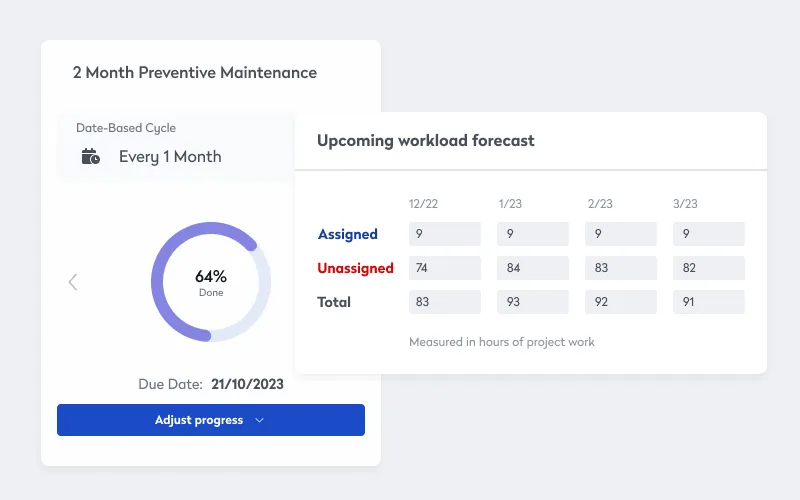
And just like you can use MTBF to help you set up inventory control, you can also use it to schedule preventive maintenance inspections and tasks. If you know an asset, on average, fails after roughly 1000 hours of operation, you can set PMs at every 85.

Remember, MTBF tells you when the asset or equipment tends to fail, and a quick review of your data can tell you why it tends to fail. By looking at both the why and the when, you can have the right set of inspections and tasks at the right time.
MTBF is a powerful maintenance KPI that helps you make repair-or-replace decisions and track how well the team is maintaining critical assets. The best way to capture the data you need to calculate MTBF and then leverage it into actionable is with a digital facilities and maintenance management platform that automates critical workflows. The maintenance techs get the support you need, while the department enforces effective, efficient work.
Frequently asked questions
MTBF is the average number of operational hours an asset runs before it requires repair. It’s a key performance indicator for reliability and is only calculated for assets that can be fixed, not replaced outright.
By identifying how often assets fail, teams can set preventive maintenance schedules, optimize inventory levels for critical parts, and assign the right technicians for repairs — reducing downtime and costs.
Low MTBF may be due to normal asset wear, poor maintenance practices, or operator error. Reviewing operational processes and maintenance history can help pinpoint the cause and guide corrective action.


