The goal of preventive maintenance is to get out ahead of problems, so the maintenance department can find and fix small issues before they grow into larger problems. Simple seasonal HVAC inspections and tasks help keep offices warm in the winter and server rooms cool year-round, for example. And for large enterprises, those savings multiply across portfolios of facilities and office spaces.
But with the P-F curve, it’s better to be behind, back in between the intervals.
What is the P-F curve?
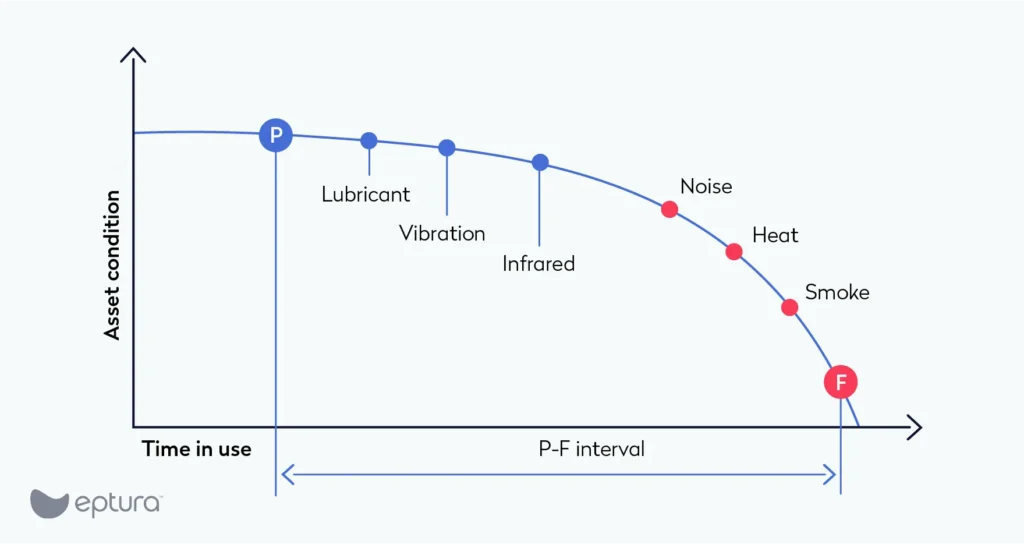
The P-F curve is a graphical representation of an asset’s behavior or condition as it slides toward failure. Along the X axis is time, while along the Y axis is the asset’s condition. You can also think of Y as representing the asset’s ability to resist failure.

The value of the curve to operations and maintenance professionals is how it makes it easier to see what happens as an asset starts its downward slide.
Leveraging the P-F curve starts with understanding the potential failure points, functional failure point, and the P-F intervals.
What is a potential failure?
Each potential failure point is where we can detect that an asset is moving toward a functional failure. For the points early in the curve, we likely need sophisticated sensors and testing to catch them. As you move down the curve, though, the signs of trouble become more obvious. At first, only asset-mounted sensors might feel the increase in vibration. Eventually, though, it’s large enough for the operator to notice the asset rocking. Another example is where you need advanced chemical testing on an engine’s fluids to detect problems long before you see more obvious signs like noise, heat, or smoke.
What is a functional failure?
There are all kinds of failures, so it’s important to have a clear definition. A functional failure is when the asset is no longer delivering the desired results.
That could mean the output is correct but too slow. Taking an example from manufacturing, an asset should be filling a hundred paint cans every five minutes, but it now takes a full hour. A functional failure could also mean that there’s a problem with the quality of the output. So, you’re getting the right number of paint cans every five minutes, but they’re only half full. Complete failures are also possible, which in this example means no paint cans at all.
Another way to think of a functional failure is to take the asset offline and repair it. The good news here is that you can set the functional failure point early for each of your assets to ensure everyone stays safe. So, instead of saying the functional failure point for an engine is when it seizes, you can set it earlier in the curve, at a spot where the temperature is high but still low enough to make catastrophic failure impossible.
What is a P-F interval?
The amount of time you have between detecting a potential failure and the asset reaching its functional failure is the P-F interval.
The important thing to remember here is that there are different lengths of time between each potential failure and the functional failure. So, if an engine is making a strange knocking sound, you might have another few weeks before it hits functional failure. But if there’s smoke, you might have only seconds.
What are the benefits of the P-F curve?
The curve can tell you what to look for and how often you should look for it.
If you know that one of the potential failure points for an engine is excessive vibration, you should include vibration inspections in the schedule. And if you know the P-F interval for vibrations is one week, then you should schedule your vibration inspections at intervals that are less than a week. A loose rule of thumb is to schedule inspections at half the P-F interval. So, a potential failure with a P-F interval of one week gets an inspection every three and a half days.
Another benefit is that when you do find a potential failure, you know how much time you have to prioritize, plan, schedule, and close out the maintenance.
For larger maintenance departments responsible for vast numbers of assets and equipment spread over multiple facilities, improved operational efficiencies from better allocation of resource — including parts, materials, and labor — quickly multiply, delivering lower costs, increased uptimes.
How is the P-F curve connected to reliability-centered maintenance (RCM)?
Different potential failures have different intervals, which means you want to find the earliest possible potential failure to give yourself the longest possible interval.
It’s the same with doctors and disease. Early detection means more time to work the cure.
Chemical tests on the fluids in an engine give you the earliest possible potential failure and the matching longest interval. If you wait until you see smoke, the interval is now likely down to seconds.
The connection to RCM is that this maintenance strategy can include technology that constantly monitors assets and equipment, making it possible for you to catch potential failures early.
For example, you have a vibration sensor on an asset checking that everything is staying within preset limits. As soon as the asset vibrates too little or too much, the clock starts on the P-F interval. But early detection means you have lots of time to plan and carry out repairs.
Or, you could have a schedule of periodic vibration inspections. Instead of keeping the sensor on the asset all the time, you collect data at carefully scheduled intervals. How do you know how often to check? A general rule of thumb is half the P-F interval for that specific potential failure.
How does facility management software make getting behind the P-F curve easier?
It would be great if all your assets and equipment came with their P-F curve in the manual.
But even if they did, eventually you’d need to create your own curves. When the manufacturer first designed and produced the asset, they were the experts. But now that it’s lived with you for a while, you likely have a better understanding of any potential problems.
But when your paperwork is on loose pieces of paper or spread out on endless spreadsheets, it’s hard for you to leverage your data into useful insights.
A modern unified facility management platform makes it easy. It helps you capture data in real-time, ensuring accuracy. And then it takes all that data and keeps it safe and secure in one location, which makes it easy to access and share. Now that you have access to complete and reliable asset maintenance and repair histories, you can see what your potential failures are and generally how long you have until functional failure.


